
Release of SQX 139 Dev 1 and what’s planned for year 2024
We’d like to announce the release of the new SX 139 Dev 1 version – note that this is a development version for testing, not the final 139 version. Most …
Přejít k obsahu | Přejít k hlavnímu menu | Přejít k vyhledávání
Curve-fitting strategy to the historical data on which it was build is the biggest danger of strategies generated using any machine learning process.
After developing new strategy you should make sure your strategy is robust – which should increase the probability that it will work also in the future.
What is robustness?
It is simply the property of strategy of being able to cope with changing conditions.
– First of all, strategy should work on unknown data (if the market characteristics didn’t change) either with or without periodic parameter reoptimization.
– It should not break apart if some trades are missed.
– Robust strategy should not be too sensitive to input parameters – it should work even if you slightly change the input parameter values, such as indicator period or some constant.
the most basic test for robustness is testing the strategy on Out of Sample data. If you run genetic evolution, the strategy is evolved only on the In Sample part of data. The Out of Sample part is “unknown” to the strategy, so it can be used to determine if the strategy performs also on unknown part of data.
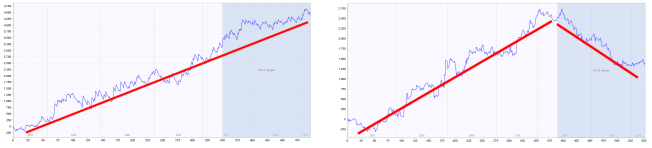
The blue part of each chart is the Out of Sample (unknown) data., We can see that the strategy on the left performs well also on this part, while strategy on the right fails on the unknown data – it is almost certain to be curve fitted.
second test for robustness is very though – it means testing the same strategy on different symbol(s) and/or another timeframe(s). Robust strategy should ideally work on multiple symbols/timeframes.
In reality, because each market has its own characteristics, daily volatility, etc., it will be not easy to find a strategy that has the same perfect performance on multiple symbols using just one set of settings.
We can be satisfied if the strategy performs on other markets with at least some degree of profitability, or just slightly losing.
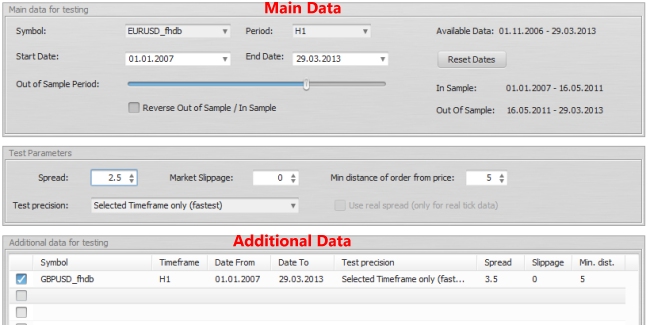
StrategyQuant allows you to specify additional symbols for building/testing the strategies in the Additional data section. You can even test the strategy on the same symbol with different timeframe.


(click on image to see bigger version)
In the two charts above you can see test of strategy on EURUSD (green line), GBPUSD (cyan line) and portfolio of both (blue line).
While on the left chart the strategy performs well on both currencies, on the right chart you can see that performance on GBPUSD is bad. This strategy is probably not robust enough.
StrategyQuant allows you to turn on Robustness Tests. Robustness Tests tool simply repeatedly tests the strategy with different random changes in the input parameters and data performing Monte Carlo simulation.
The idea behind this robustness testing is to verify how well the strategy performs when there are small changes in inputs, history data or other components of the strategy.
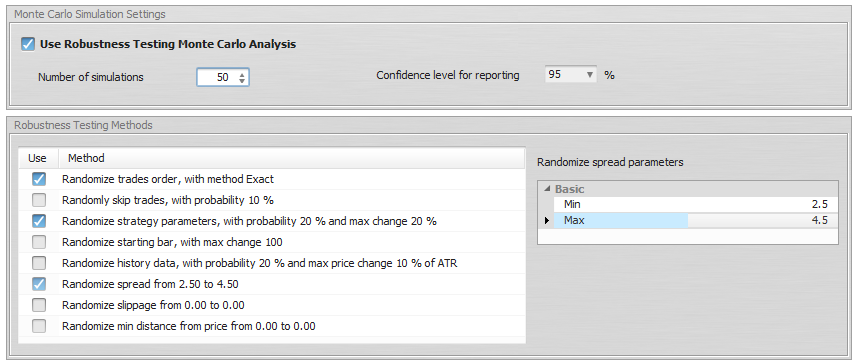
You can simulate different properties:
– Randomize Trades Order – this is the simplest test, it randomly shuffles order of the trades. This doesn’t change the resulting Net Profit, but it is very useful in examining different variations of Drawdown that can be a result of different order of trades.
– Randomly Skip Trades – it will randomly skip trades with given probability. In real trading you can often miss a trade because of platform or Internet failure, or simply because you paused trading for some time. This test will give you an idea how the equity curve might look like if some trades are randomly skipped.
– Randomize Starting Bar – this will test the strategy behavior when the testing starts on a different starting bar. It is obvious that a good strategy cannot be sensitive to which bar you start the test.
– Randomize Strategy Parameters – every strategy uses parameters, such as period of an indicator or constant that is used in comparison. This test checks the sensitivity of the strategy to a small change of parameter value. Probability of change is a probability that any parameter changes its value. Max parameter change is the maximum percentage to which the parameter changes its value. For example if you set Max parameter change to 10%, then a parameter with value 60 can be randomly changed to a range 54 – 66 (+- 10% of its original value of 60).
– Randomize History Data – one very common case of curve fitting is when strategy is too dependent on history data. This option checks the behavior of the strategy to a change in history data.
The Probability of change sets for every bar how probable it is that open, high, low or close price will be changed. The Max price change is a percentage value of the change in relation to ATR (Average True Range).
So if for example close price is randomly chosen to be changed, ATR value is 10 pips, and Max price change is 20%, then the price can change by +- 2 pips
Interpreting the results
Robustness tests output the results as a set of equity charts for each testing run AND a table showing the results of Monte Carlo simulation.
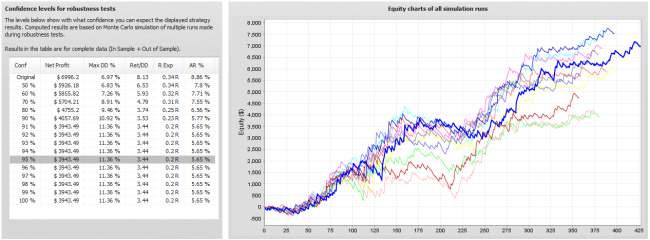
In this example we’ve run 10 simuations, with random changes in strategy parameters, history data and randomly skipped trades.
We can see what would be the equity for each of these simulations and the table on the left provides us the valuable information on the strategy properties during these simulations.
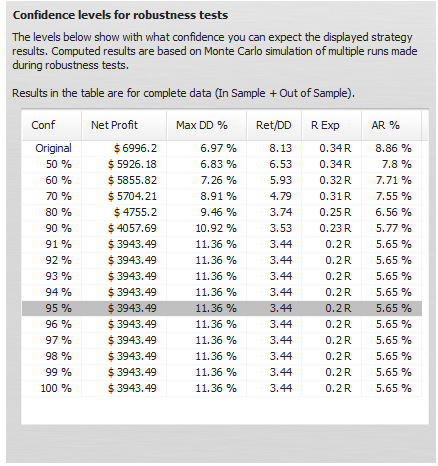
What do these values mean?
The first row displays values of Net Profit, Maximum % Drawdown etc. of original strategy for comparison.
The rest of the rows display values at different confidence levels.
These numbers are a result of Monte Carlo analysis applied on our 10 random simulations.
For example, values at 80% confidence level mean that there is 20% chance that Net Profit, Drawdown etc. will be worse than the confidence level values.
Values at 90% confidence level mean that there is 10% chance that Net Profit, Drawdown etc. will be worse than the confidence level values.
Values at 95% confidence level mean that there is only a 5% chance that Net Profit, Drawdown, etc. will be worse than these values.
So Monte Carlo simulation of our strategy shows us that by skipping 10% of random trades and small random changes in input parameters and data our Net Profit can decrease from $ 6990 to $ 3943, and Maximum Drawdown can increase from 6.97% to 11.36%.
This means that there is only 5% chance that Net Profit will be lower than $ 3943. By looking at the higher confidence levels we can see that none of our tests had worse results than $ 3943, so the strategy seems to be relatively robust to the changes we exposed it to.
Because robustness tests are generated randomly, equity charts and values in the table will slightly differ every time you retest the strategy. Also, the more simulations you’ll run, the bigger statistical significance of this test.
Fourth type of robustness check is test using Walk-Forward Matrix. If the strategy passes this test it means that with the help of parameter reoptimization it is adaptable to a big range of market conditions.
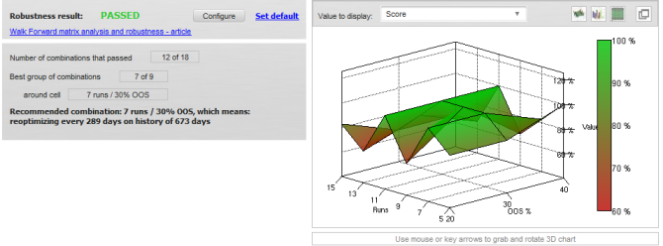
Check these links for detailed articles about Walk-Forward Optimization and Walk-Forward Matrix.
We’d like to announce the release of the new SX 139 Dev 1 version – note that this is a development version for testing, not the final 139 version. Most …

Dive into Algorithmic Trading Without the Coding Headache! Are you intrigued by algorithmic trading but dread the thought of coding? Today marks the beginning of our exciting series that’s about …
 Tomas Vanek
5. 3. 2024
In this interview, we catch up with Naoufel, a seasoned trader, to explore his journey through the stormy market of 2023. Naoufel is successful trader with verfied track record who …
 Ellie Souckova
12. 12. 2023