


 英語
 スペイン語
 ポルトガル語
 フランス語
 イタリア語
 ドイツ語
Tracking Swing Points on Renko Charts
26 replies

こんにちは,
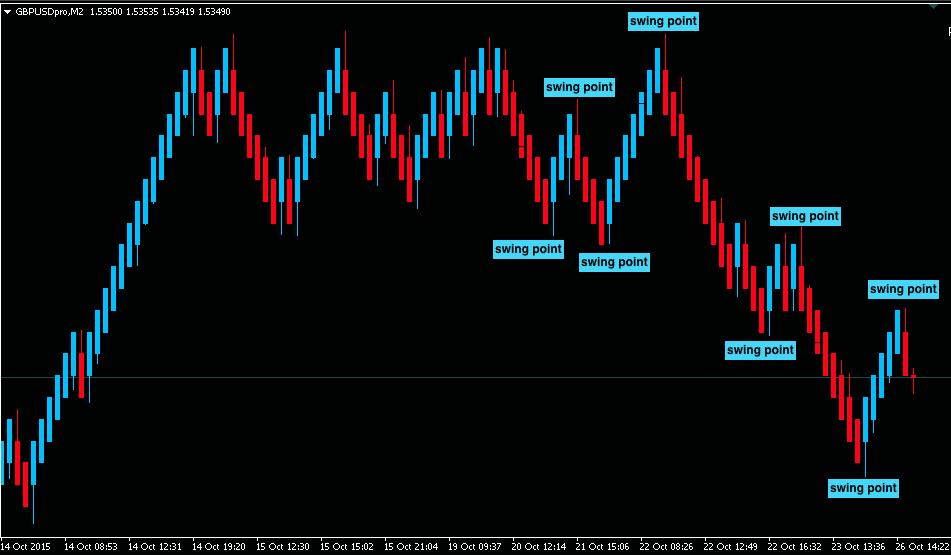
I was looking to track swing points on Renko Charts and I was hoping to get an idea of how to do this. I understand needing to use variables but where I’m stuck is how to start looking back to assign the variables.
Does anyone have any ideas? Take a look at the uploaded image. Thanks for any help with this.
よろしくお願いいたします。,
ジェームズ
 Screen Shot 2015-10-26 at 2.25.19 PM.png
0

I see the easy way which is if there are two (or three if you like) consecutive bearish or bulish candles then swing is defined. This logic can be used to define rules in Wizard and last swing price will be basically High[2] or Low[2]
The problem is if you want to “store” those swing prices. How many swing prices do you need to reference? You can create multiple variables to store that prices like Swing1, Swing2, Swing3 and when a new swing is detected you just set Swing1 variable to the last swing price (High[2]/Low[2]), Swing2 to Swing1 value. Swing3 = Swing2 etc. You can then compare individual swing prices. But it can get very complicated if you want to reference lets say last 20 swings or more…..
Do you want me to make an Wizard example for this?
0
Thanks Tomas262,
I think ideally I will only need to track 3 or 4 of the swing points. What I’m trying to do is to determine if the last swing has been broken in the current trend. If it hasn’t then don’t take anymore trades in that direction until the last swing point has been broken etc…
Question, can I have EAWizard look back and track the swings already on the chart or do I have to wait and have new swings be created and then start tracking those etc…?
お手伝いありがとうございます。.
よろしくお願いいたします。,
ジェームズ
Oh, yes any example is always helpful for I am a visual learner. 🙂
0
Good Evening Tomas262,
I’ve been working on a few options to track the swing points but I seem to be a bit lost in how to get the swing point and then comparing it to the previous swing point.
I’m trying to identify ranging price between the recent high and low that you see on Renko charts quite frequently. If possible could you point me in the right direction or suggestions. Thanks for your time and expertise.
よろしくお願いいたします。,
ジェームズ
0
こんにちは,
I have created an expert that stores prices for last 4 swings (2 Highs + 2 Lows) in variables H1, H2, L1, L2 which can be then used in conditions. EA also draws arrows with swings and logs variables values. Tested on minute timeframes and works well. See file attached
0
Thank you Tomas262
Sorry for the late response. I had a few things come up that have consumed my time. I will play around with the example you posted (this will help me tremendously). Thank you again for all your help and input.
よろしくお願いいたします。,
ジェームズ
0
Good day Tomas262
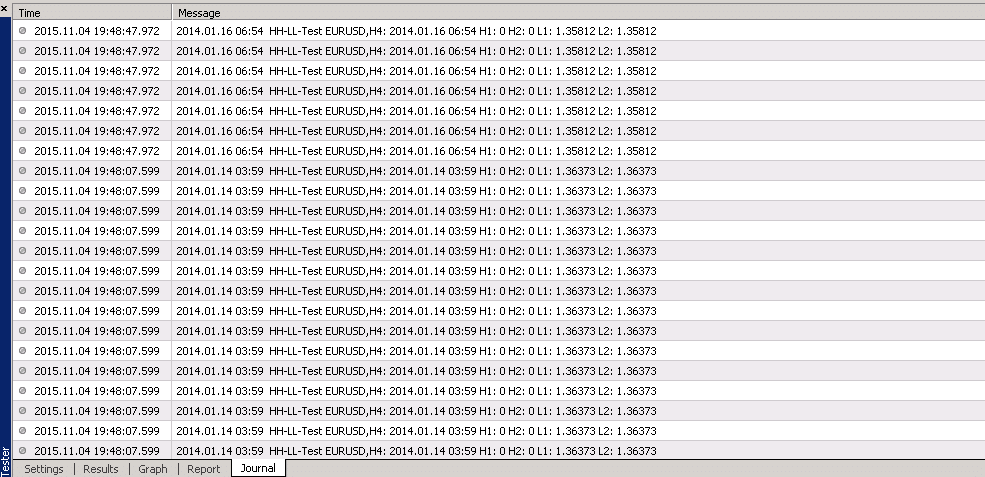
I was trying to figure out how to get a couple swing points tracked but I haven’t had much luck. I attached a screenshot of the Journal of the piece of code you posted. I’m not sure if it logs the last two swings in the journal.
I looks like both the L1 and L2 or H1 and H2 are the same number until the next highest high or lowest low. Then they both change to that price.
I think i have the swing point figured out but the tracking has got me stumped. I think I’m missing something here in my understanding of how to have the variables progress as the swing points are created.
Any input would be very helpful. Thank you for any help.
よろしくお願いいたします。,
ジェームズ
 Screen Shot 2015-11-11 at 10.51.16 PM.png
0
こんにちは、Tomas262さん
I have found a good solution for tracking up to six swing highs and six swing lows. Thanks for your ideas to help me.
The only issue I’m running into and thought you might know a good way to remedy it.
I found that if I’m using the open > close (3 up then 3 down) that when the pattern isn’t exactly that it won’t register the swing high or low. So, I started trying to figure out a way to use price movement in pips. I can then use a variable for the bar size.
I’m finding it hard to get the correct use of the lowest low and highest high to get the right price for the swing point. Do you have any ideas? No hurry or rush, i’m trying each idea that comes to mind. 🙂
Thanks again.
よろしくお願いいたします。,
ジェームズ
0
こんにちは、Tomas262さん
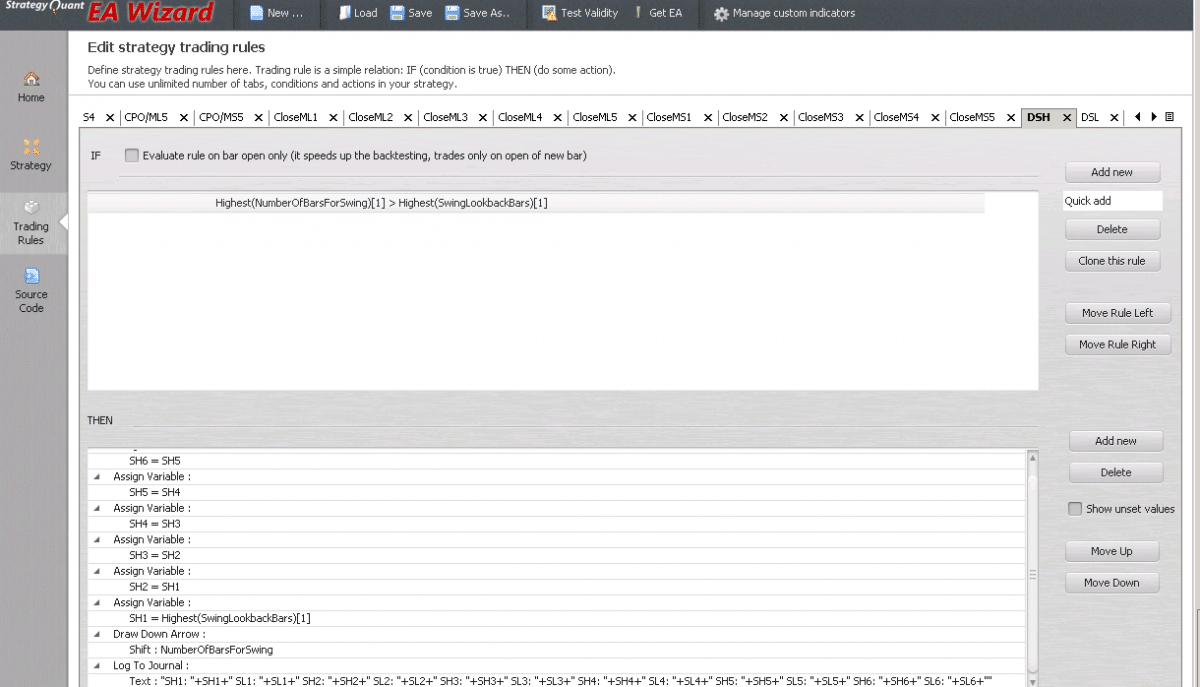
Here is a screenshot of the code I thought would work, but it seems to not be placing the arrow or logging the swing points now. I’m not sure why. The code seems pretty straight forward and simple. Let me know if you see something out of sorts.
NumberOfBarsForSwing=3
SwingLookbackBars=10
ありがとう。.
よろしくお願いいたします。,
ジェームズ
 Screen Shot 2015-11-19 at 10.17.35 AM.png
0
Do you stil have problems logging messages to journal and displaying arrows? I cannot see a reason why it shouldn’t work. Maybe if you upload your project or send to [email protected] I can have a look
0
Sorry for the delay Tomas262,
The issue I’m seeing isn’t the journal or arrows per say. Where I’m having a problem is when price on the renko bars doesn’t move 3 down then 3 up in a row one after another. Or visa versa.
Where it fails to display arrows and log to journal is when there is an opposite direction bar thrown into the pattern. So, I have been trying to figure out a way to have it calculate off the renko bar size and pip movement instead of the Open > Close etc…
I think I have a solution but it seems a bit complicated. I need to figure out an easier way to write it. Thanks again for your input it has helped tremendously to say the least. I’ll let you know if I figure out a good solution.
Thanks again.
よろしくお願いいたします。,
ジェームズ
0
Tomas262さん,
I have a quick question…do you know of a way to display an arrow at the lowest low of the last 10 bars or highest high of the last 10 bars?
Thanks a million.
よろしくお願いいたします。,
ジェームズ
0
Tomas262
I figured out a good way to set the arrow. I do have a question about how you used a “Double” instead of an “Int”. Is this because the EA Wizard won’t track price unless it is a Double?
ありがとう。.
よろしくお願いいたします。,
ジェームズ
0
You need to use double to store numbers containing decimal fraction which fits market price best. Integers are only used for whole numbers.
0
Thanks Tomas262
I have figured out how get up to 6 swing points logged and tracked. The only issue I’m trying to figure out and not sure if it is possible with the EA Wizard and that is to have the display arrow at the swing high or swing low.
I have figured out a way to display the arrow at the lowest low or highest high. So, with the display arrow the option is only for “Shift”? Have you ever found a way to display an arrow at a specific price?
Thanks and Happy Thanksgiving!
よろしくお願いいたします。,
ジェームズ
0
Yes, the only option with built-in arrows is shift. But it can serve you well. Up arrow is always below candle low while down arrow is always places right above candle high. Why do you need to specify a price level? Just to move arrow further from the price chart?
0