


 英語
 スペイン語
 ポルトガル語
 フランス語
 イタリア語
 ドイツ語
Robustness test charts look strange
1件の返信

Has anybody seen that RT results on the equity chart sqwashed to the left (see the attached screenshot).
What could be wrong with settings or data?
ファイル  image.png
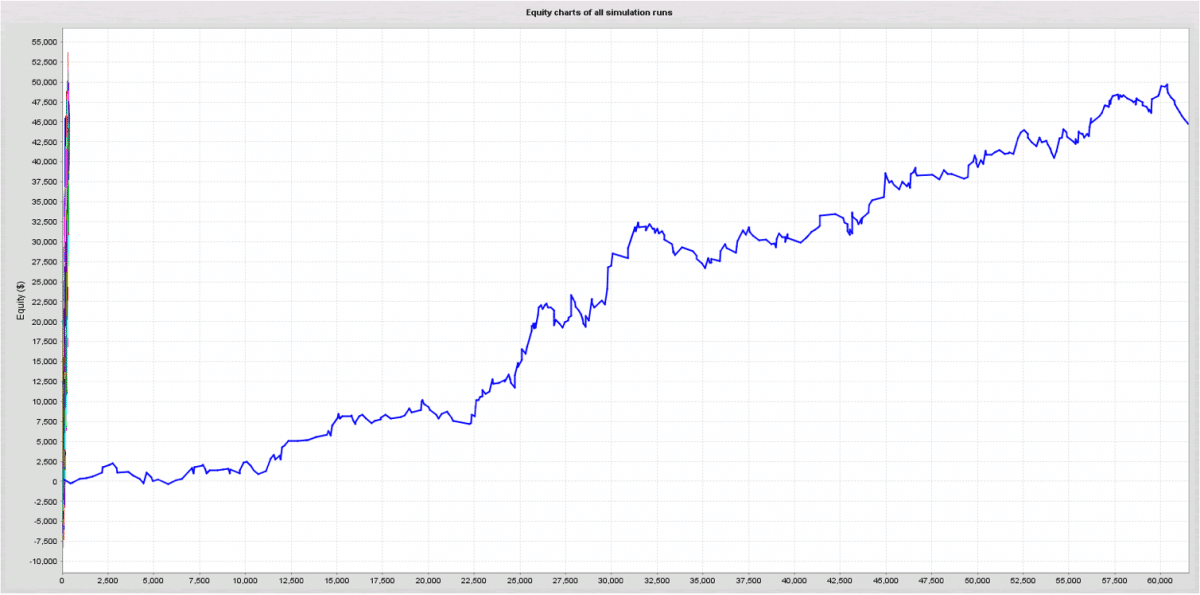 image.png
0

Has anybody seen that RT results on the equity chart sqwashed to the left (see the attached screenshot).
What could be wrong with settings or data?
Yes, I have also encountered this several times.
It usually comes with extremely narrow profit trailing pips, which is an error.
0
1件の返信を表示中 - 1 - 1件目 (全1件中)