We have added several new indicators and snippets to the sharing server in recent months. In today’s blog post, we’ll briefly go through each of them.
BHエルゴシック

The formula used to calculate the BH Ergodic Oscillator is the price difference for a given number of bars. The difference is smoothed by three moving averages and the signal line is calculated by smoothing the main line.
The values of the BH Ergodic indicator fluctuate around the zero line. At the peak, the values may approach 100. At the lows, the values may approach -100. High values of the indicator can mean that the market is in a strong uptrend or the price is in the overbought zone. Large negative values can mean that the market is in a strong downtrend or the price is in the oversold zone. The signal can occur when TSI line crosses/is above or below Level or when TSI line crosses above/below Signal Line.
インジケーターには1本の線があります:
- TSI
- Signal
以下の基本条件を追加しました:
- BH Ergodic is rising/falling
- BH Ergodic is above/below level
- BH Ergodic crosses above/below level
インジケーターの対応プラットフォーム:MT4 / MT5 / TradeStation / MultiCharts
インジケーターと条件はこちらからダウンロードできます
Didi Index DI
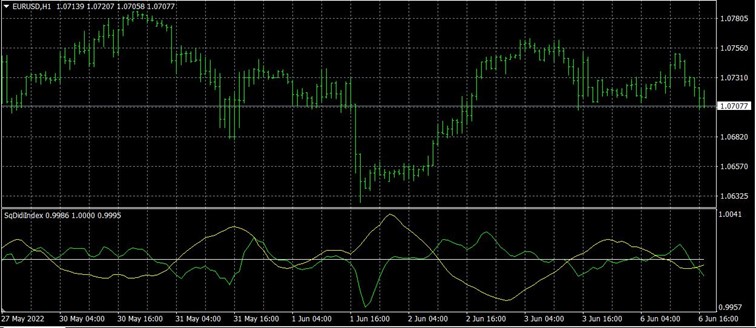
DIDI指数は、短期、中期、長期の移動平均線を用いて計算されます。緑色の線は短期移動平均線を中期移動平均線で割って算出され、黄色い線は長期移動平均線を中期移動平均線で割って算出されます。.
The indicator has four parameters:
- 短期移動平均線期間
- 中期移動平均線期間
- 遅い移動平均期間
- 移動平均の種類
インジケーターには3つのラインがあります:
- 短期移動平均線
- 長期移動平均線
- 静的線は常に1に等しい
以下の基本条件を追加しました:
- ディディ指数が上昇/下落している
- ディディ指数が上下にクロスする
インジケーターの対応プラットフォーム:MT4 / MT5 / TradeStation / MultiCharts
インジケーターと条件はこちらからダウンロードできます
Connors RSI – CRSI
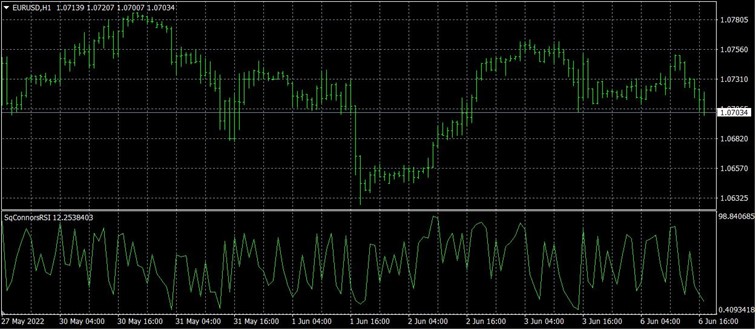
コナーズRSI(CRSI)は、ラリー・コナーズによって開発されたテクニカル分析指標であり、3つの別々の要素で構成されています。相対力指数(RSI)はコナーズRSIの中心であり、この指標の3つの要素のうち2つにRSIが使用されています。RSI、アップ・ダウン・レングス、変動率(レート・オブ・チェンジ)の3つの要素が組み合わさることで、モメンタムオシレーターを形成します。コナーズRSIは0から100の間の値を出力し、それは次を特定するために使用されます たいてい 短期的な買われすぎおよび売られすぎの状態.
このインジケーターには2つのパラメータがあります:
- RSI期間
- ROC期間
インジケーターには1本の線があります:
- CRSI
以下の基本条件を追加しました:
- CRSIが水準の上/下にある
- CRSIがレベルを上抜け/下抜けする
インジケーターの対応プラットフォーム:MT4 / MT5 / TradeStation / MultiCharts
インジケーターと条件はこちらからダウンロードできます
Semaphore Signal Level Channel – SSL
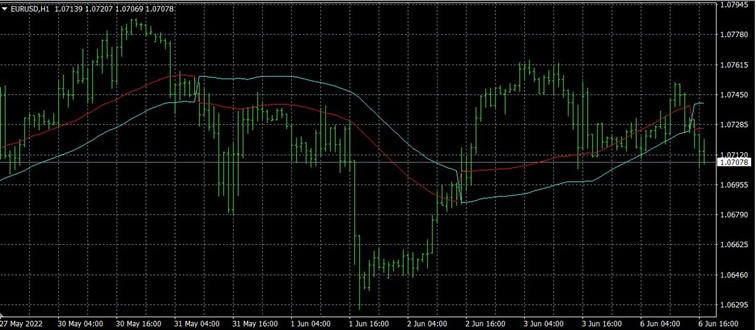
このインジケーターは2つの移動平均線で構成されており、一方は価格の高値に、もう一方は価格の安値に適用され、市場価格に追随するエンベロープ曲線を作り出します。価格が2つの移動平均線の上から下に、あるいはその逆に移動する反転テクニックに基づいてトレードを行うという考え方です。.
2つの移動平均線が交差すると、そのインジケーターは価格の動きが方向を変えた、または変えようとしていること(ロングからショートへ、あるいはショートからロングへ)を示唆します。.
インジケーターには2つのパラメータがあります:
- 移動平均の種類
- LB – ピリオド
移動平均の種類を選択できます
インジケーターには2本の線があります:
- SSLU
- SSLD
これらの条件を追加しました。 カスタムブロック:
- 終値がSSLUの上/下にある
- 終値がSSLDの上/下にある
- CloseはSSLDとSSLUの間にあります
- 終値はSSLDとSSLU x バーの間です
- SSLUはSSLDの上/下です
インジケーターの対応プラットフォーム:MT4 / MT5 / TradeStation / MultiCharts
インジケーターと条件はこちらからダウンロードできます
Waddah Attar Explosion – WAE
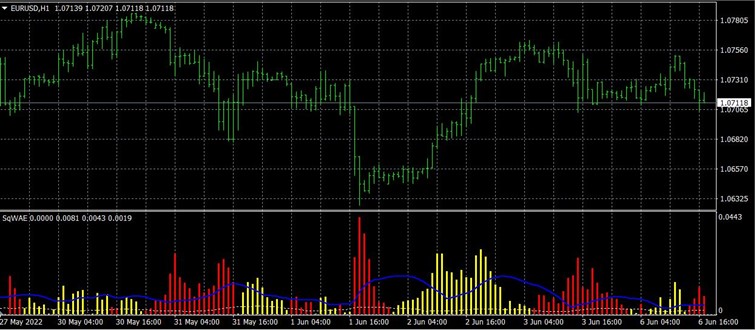
Waddah Attar Explosion – WAE combines the Bollinger Bands and the MACD in a unique way. With WAE indicator you can see with high probability when these explosions start and when they end. The “explosion” of price volatility is measured by the difference between the upper and lower Bollinger Band (also called “squeeze”) and its direction is measured with a slow MACD rise or fall and weighted by a coefficient – Sensitivity.
インジケーターには2本の線があります:
- WAEPositive
- WAENegative
- Explosion
- Dead
これらの条件を追加しました。 カスタムブロック:
- WAE Negative above Explosion
- WAE Positive above Explosion
- WAE Positive and Explosion is rising X Bars
- WAE Negative and Explosion is rising X Bars
- WAE Negative below Explosion X Bars
- WAE Positive below Explosion X Bars
インジケーターの対応プラットフォーム:MT4 / MT5 / TradeStation / MultiCharts
インジケーターと条件はこちらからダウンロードできます
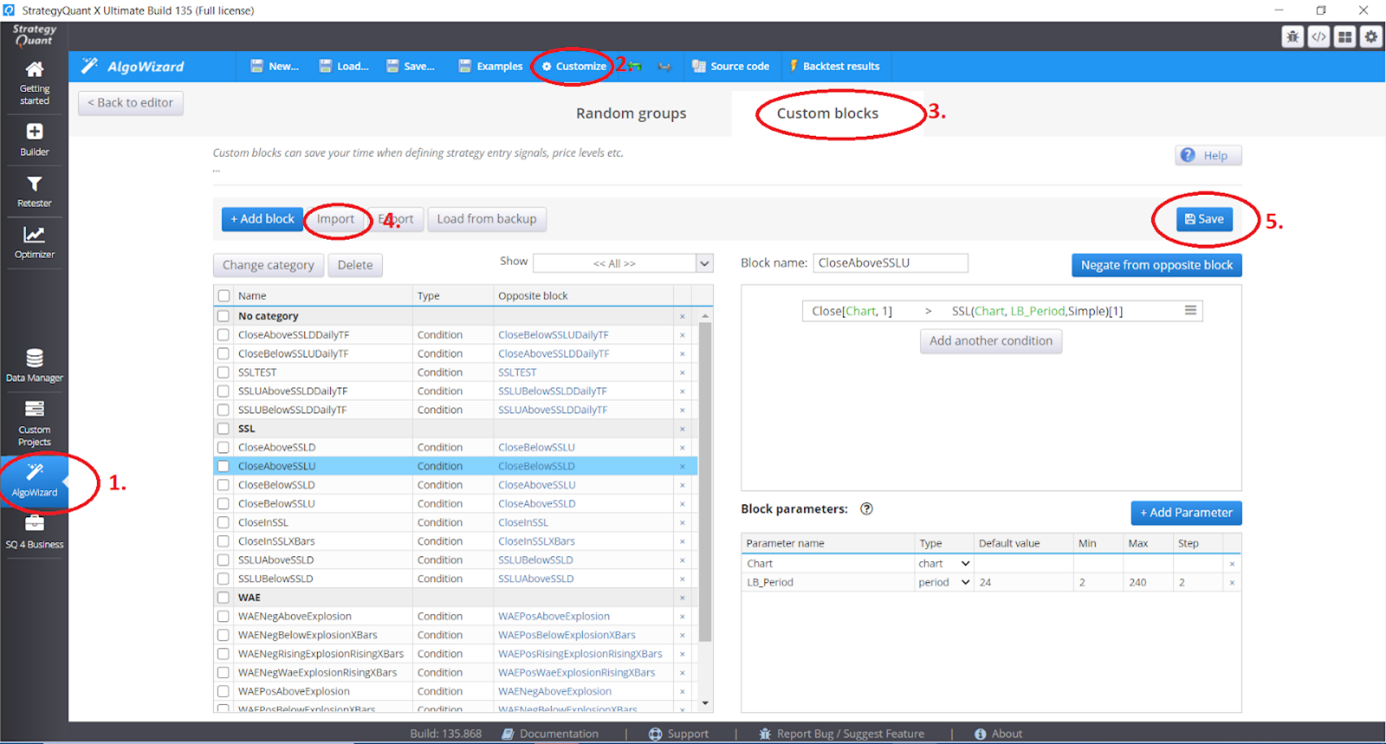
I have prepared the conditions for the last two indicators SSL and WAE in the form of custom blocks. Their import looks like this:
- SQXでアルゴウィザードを開く
- カスタマイズを選択
- カスタムブロックを選択
- カスタムブロックをインポート
- 彼らを救え
In this module you can also modify the custom blocks – change the time periods, change the steps, etc.
カスタムブロックを使うと、条件分岐を簡単に行うことができます。詳細はこちらをご覧ください:
SQXにカスタムインジケーターをインポートする方法:



 英語
 スペイン語
 ポルトガル語
 フランス語
 イタリア語
 ドイツ語






The Connors RSI download link takes you to the RVI download screen. Please correct.