We have added several new indicators and snippets to the sharing server in recent months. In today’s blog post, we’ll briefly go through each of them.
BH Ergodic

The formula used to calculate the BH Ergodic Oscillator is the price difference for a given number of bars. The difference is smoothed by three moving averages and the signal line is calculated by smoothing the main line.
The values of the BH Ergodic indicator fluctuate around the zero line. At the peak, the values may approach 100. At the lows, the values may approach -100. High values of the indicator can mean that the market is in a strong uptrend or the price is in the overbought zone. Large negative values can mean that the market is in a strong downtrend or the price is in the oversold zone. The signal can occur when TSI line crosses/is above or below Level or when TSI line crosses above/below Signal Line.
The indicator has one line:
- TSI
- Signal
We have added these basic conditions:
- BH Ergodic is rising/falling
- BH Ergodic is above/below level
- BH Ergodic crosses above/below level
Indicator is implemented for: MT4/MT5/Tradestation/ Multicharts
You can download the indicator and conditions here
Didi Index DI
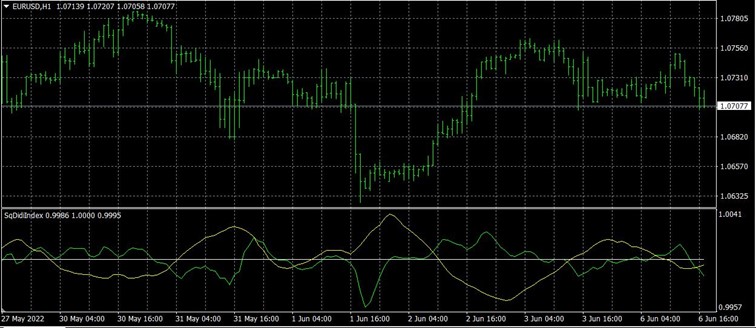
The DIDI index is calculated using the short-term, medium-term, and long-term moving averages. The green line is calculated by dividing the short-term moving average by the medium-term moving average, and the yellow line is calculated by dividing the long-term moving averages by the medium-term moving averages.
The indicator has four parameters:
- Fast MA Period
- Medium MA Period
- Slow MA Period
- Type of Moving Average
The indicator has three lines:
- Fast Moving Average
- Slow Moving Average
- Static line always equals 1
We have added these basic conditions:
- Didi Index is rising/falling
- Didi Index crosses Up/Down
Indicator is implemented for: MT4/MT5/Tradestation/ Multicharts
You can download the indicator and conditions here
Connors RSI – CRSI
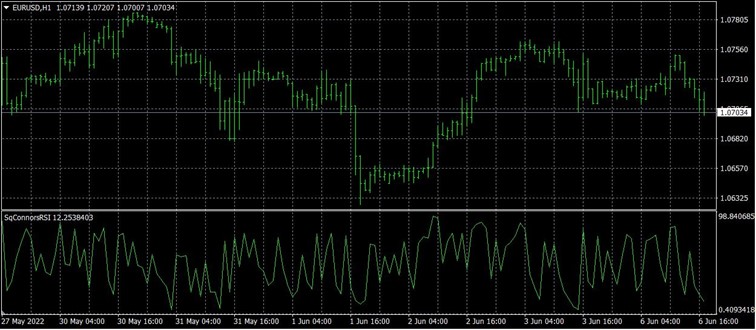
The Connors RSI (CRSI) is a technical analysis indicator developed by Larry Connors that is made up of three separate components. The Relative Strength Index (RSI) is the core of the Connors RSI. RSI is used in two of the three components of the indicator. The three components, RSI, UpDown Length and Rate-of-Change, together form a momentum oscillator. Connor’s RSI outputs a value between 0 and 100, which is then used to identify mostly short-term overbought and oversold conditions.
The indicator two parameters:
- RSI Period
- ROC Period
The indicator has one line:
- CRSI
We have added these basic conditions:
- CRSI is above/below level
- CRSI crosses above/below level
Indicator is implemented for: MT4/MT5/Tradestation/ Multicharts
You can download the indicator and conditions here
Semaphore Signal Level Channel – SSL
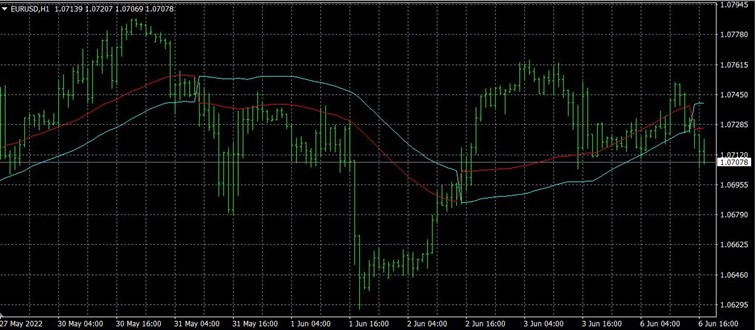
This indicator consists of two moving averages, one of which is applied to the high of the price and the other to the low of the price, creating an envelope curve that follows the market price. The idea is to trade based on the flip technique, where the price moves from above the two moving averages to below them and vice versa.
When the two moving averages intersect, the indicator signals that the price movement is changing direction or is about to change direction (from long to short or from short to long).
The indicator has two parameters:
- Type of Moving Average
- LB – Period
You can select a type of moving averages
The indicator has two lines:
- SSLU
- SSLD
We have added these conditions as custom blocks:
- Close is above/below SSLU
- Close is above/below SSLD
- Close is between SSLD and SSLU
- Close is between SSLD and SSLU x Bars
- SSLU is above/below SSLD
Indicator is implemented for: MT4/MT5/Tradestation/ Multicharts
You can download the indicator and conditions here
Waddah Attar Explosion – WAE
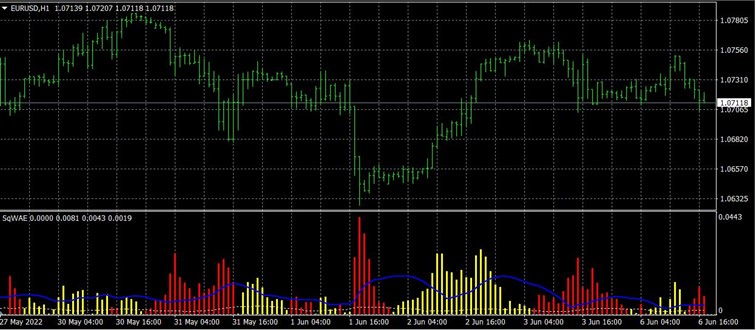
Waddah Attar Explosion – WAE combines the Bollinger Bands and the MACD in a unique way. With WAE indicator you can see with high probability when these explosions start and when they end. The “explosion” of price volatility is measured by the difference between the upper and lower Bollinger Band (also called “squeeze”) and its direction is measured with a slow MACD rise or fall and weighted by a coefficient – Sensitivity.
The indicator has two lines:
- WAEPositive
- WAENegative
- Explosion
- Dead
We have added these conditions as custom blocks:
- WAE Negative above Explosion
- WAE Positive above Explosion
- WAE Positive and Explosion is rising X Bars
- WAE Negative and Explosion is rising X Bars
- WAE Negative below Explosion X Bars
- WAE Positive below Explosion X Bars
Indicator is implemented for: MT4/MT5/Tradestation/ Multicharts
You can download the indicator and conditions here
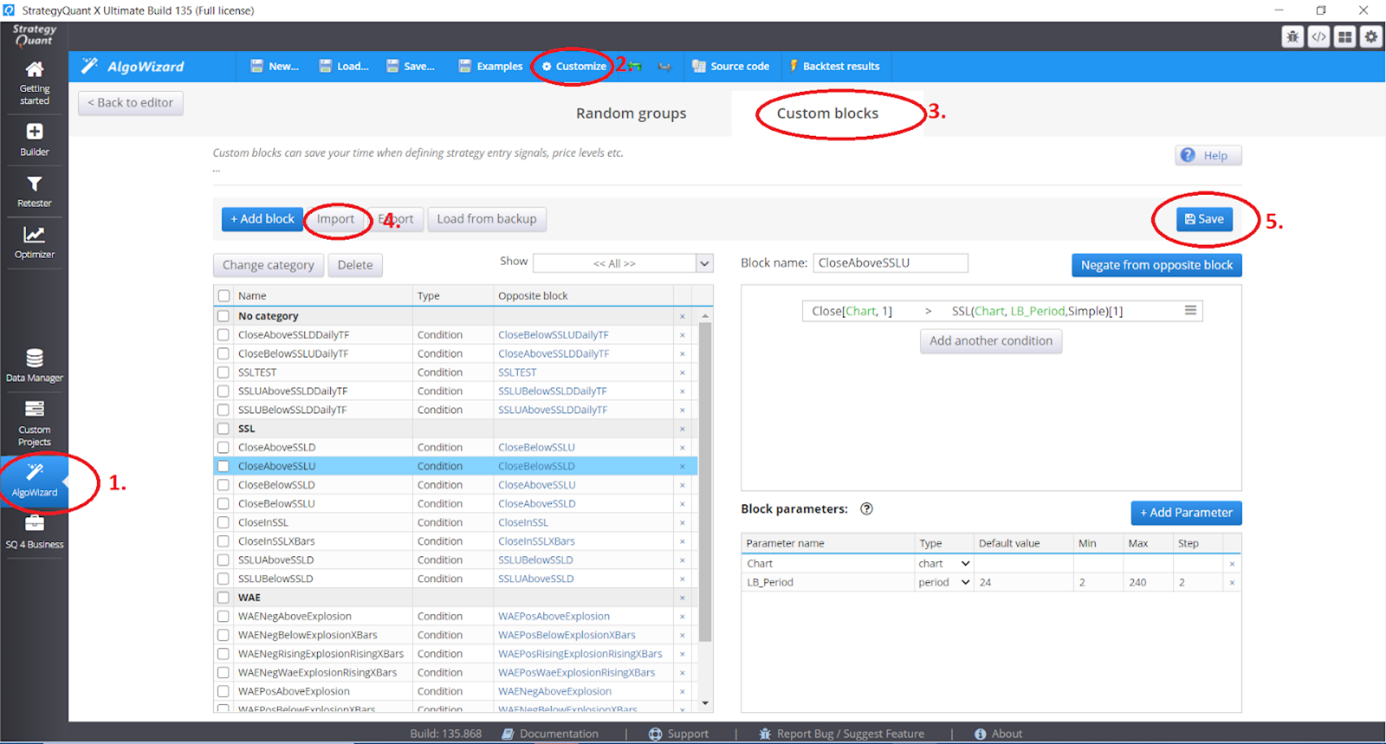
I have prepared the conditions for the last two indicators SSL and WAE in the form of custom blocks. Their import looks like this:
- Open the Algo Wizard in SQX
- Select Customize
- Select Custom Blocks
- Import Custom Blocks
- Save them
In this module you can also modify the custom blocks – change the time periods, change the steps, etc.
You can easily do your conditions in Custom blocks. More informations you can find here:
How to import custom indicators to SQX:

 Tomas Vanek

The Connors RSI download link takes you to the RVI download screen. Please correct.