Building a profitable emini strategy for ES / TF / EMD
マーク・フリック作
In this article I’ll explain the complete step-by-step process of building a profitable, robust strategy for ES (E-mini S&P 500 Futures), including 異なる堅牢性テストの複数のステップ.
This is a variation of my older article about Strategy Building Process for forex.
When using machine learning techniques such as genetic programming it is realtively easy to get strategies with nice looking equity curve. The danger lies in curve fitting, so 戦略構築プロセスにおいて最も重要な部分は、戦略の堅牢性を検証することである それが過去のデータに対して過剰適合(カーブフィッティング)していないことを保証するため。.
In this article I’ll explain how I use double OOS filter plus Robustness Tests plus Walk-Forward Matrix test.
This is the result
For motivation I post results of a nice performing strategies for ES / TF / EMD that I found using the process described below.
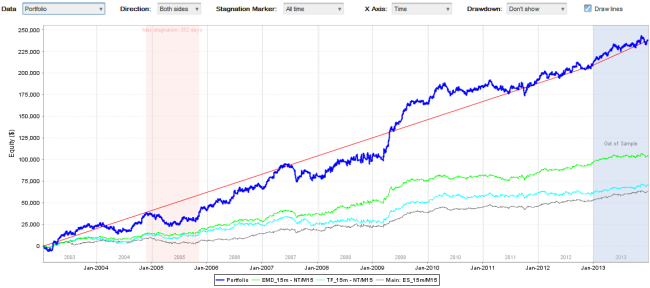 Strategy 238433 for ES/TF/EMD
The strategy above is published on our forum (only for licensed users of StrategyQuant) here:
https://strategyquant.com/forum/topic/1688-emini-strategy-for-es-tf-emd/
available for download.
入力
The only inputs I use are my expectations of the strategy – I want to build a strategy for ES (E-mini S&P 500) on 15 Min timeframe that is profitable and has as little drawdowns as possible. I want the strategy to be robust enough so that it works also on other futures (TF, EMD) and I want it to pass Walk-Forward Matrix test to make sure that reoptimization works on this strategy.
戦略構築プロセス
- データの取得
- 多数の潜在的な候補者のプールを作成する
- 最初のフィルター – サンプル外(OOS)チェック
- 第2フィルター – 再試験および2回目のOOS確認
- 第3フィルター – GBPUSDの確認
- 第4のフィルター – ロバストネス試験
- 5番目のフィルター:ウォークフォワードマトリックス検定
1. Obtaining the data
There are some differences between futures and forex. First of all, obtaining the data for futures is little bit more difficult and expensive. There are no free data sources and most brokers don’t give you history longer than few months.
You can get the data from broker who offers them (Tradestation, if you are their client) or you have to sign up for a live data service, such as Kinetick または iqFeed.
There are also some special services that dont’t offer live data feed, but that sell historical futures data. To find them just search for “historical intraday furtures data” on Google.
Second difference is that futures contracts have expiration date, contracts are usually traded for 3-4 months only and then they are replaced by newer version of the same future contract.
To be able to use the futures data for strategy development we need to have the at least few years of data in form of continuous contracts. Most of data services offer this option, so it is only a matter of subscribing to the data service and downloading the data to your trading platform.
Exporting the data from NinjaTrader
When you already have data in your NinjaTrader you have to copy them to StrategyQuant too, so it can text the generated strategies. To do that,we have to export data from NinjaTrader and import them to StrategyQuant. To export data we have to open the chart for ES 15 Min. Make sure you set the correct trading session. I use CME US Index Futures RTH session in this example.
When the chart is opened just find SQDataExport indicator and place it on the chart. It will export the data for currently opened chart to a text file.
Repeat the same process also for TF (Mini Russel 2000 Futures) and EMD (E-mini S & P Midcap 400) also on 15 min timeframe with correct trading session.
We’ll use these data later to test our strategies on other symbols as a form of robustness test.
Then open StrategyQuant and create new symbols for ES, TF and EMD and import the respective data files. Importing data from NinjaTrader is described in more details also in the Users guide.
2. Generating a big pool of potential candidates
In the first step of generation I simply have to generate large pool of potentially “good” strategies that I’ll test for robustness later. I want my all initial strategies to be profitable and robust (to some extent), so I employ several filters also in this first phase.
このステップの設定
以下のリンクから、このステップで使用している設定をダウンロードできます。リンクをマウスの右ボタンでクリックし、「名前を付けてリンクを保存…」を選択してください。
次に、StrategyQuantで「設定の読み込み」機能を使用して、この設定ファイルをプログラムに読み込みます。.
build_emini_strategy.xml
Note that if you named your symbols in StrategyQuant differently you’ll need to set the data manually.
設定の説明
First of all, I generate all my strategies on multiple symbols. My goal is to find a good strategy for ES, but I want my strategy to be robust – so I want it to be profitable also on EMD. I add EMD to the additional data, so now the strategy will be tested on both symbols.
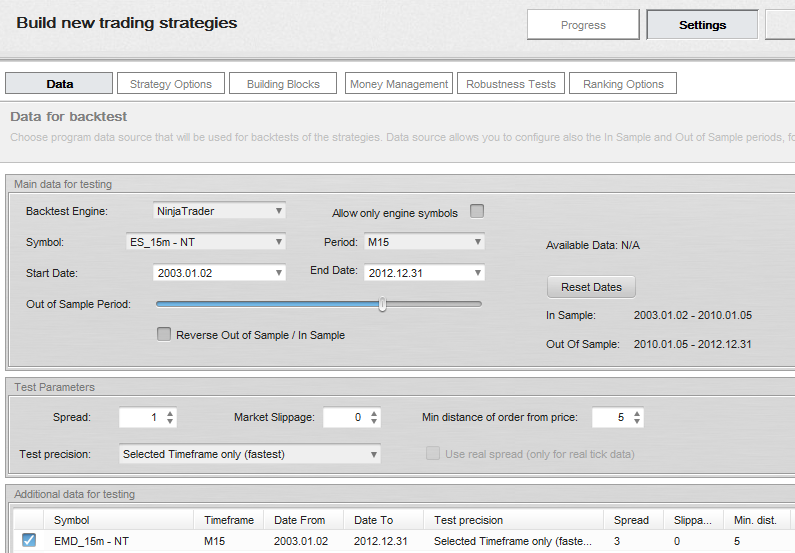
画像1:データを設定する
I’ll use data from 2.1.2003 to 31.12.2012, which is 10 years. The rest of the data will be left for further OOS testing later.
遺伝的進化モードを使用する。アイデアは、200個の戦略からなる集団を作り、30世代にわたってそれを進化させた後、最初からやり直すというものだ。こうすることで、進化のが行き止まりになるのを防ぎ、最良の戦略はデータバンクに継続的に保存される。.
初期集団の唯一の条件は、少なくとも100回のトレードを行わなければならないことであることも確認できます。利益が出る必要はありません。遺伝的進化によってそれが改善されるはずです。.
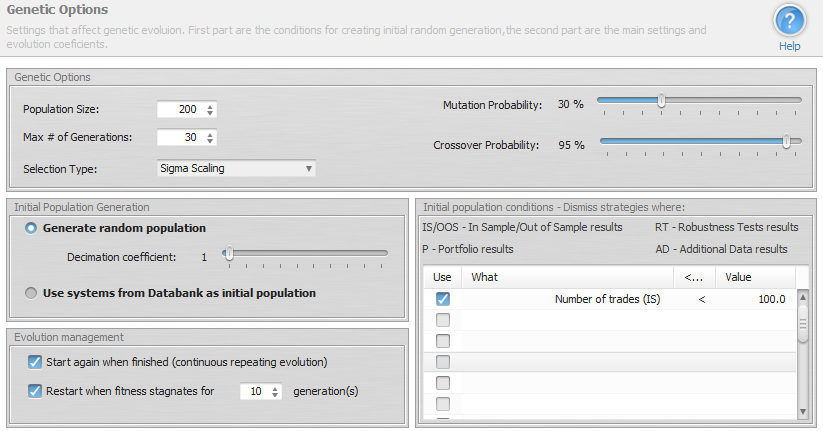 画像2:遺伝的選択肢
We could use also Random generation without evolution, but evolution should find the profitable strategies faster.
設定の最後の重要な要素はランキングオプションです。今後の選定プロセスのために十分なベースを確保したいため、データバンクに上位2000個の戦略を保存するように設定しました。また、選定基準には私のお気に入りであるリターン/ドローダウン比率を設定しました。他の選定基準を使用すれば、さらに良い結果が得られるかもしれません。.
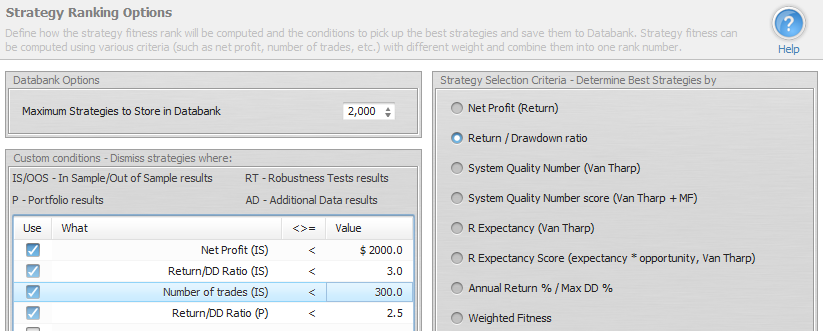
画像3:ランキングオプション
もう1つ重要なことは、Databank内の戦略に対する初期フィルタ条件を設定することです。 利益が少なくとも$2000あり、リターン/DD比率が3以上で、取引回数が300回以上、かつポートフォリオのリターン/DD比率が2.5以上である戦略のみを検討したいと考えています。.
Because I’m testing the strategies on two symbols – ES and EMD, the portfolio results for the strategies will be also computed. Using this condition I simply specify that the portfolio performance won’t be much worse than performance on only ES, and the program will dismiss all strategies with bad portfolio performance.
あとは~を叩くだけだ 開始 ボタンをクリックして、プログラムに処理を任せます。.
フィルター処理に進む前に、少なくとも2000個の「優れた」戦略を生成したいということを覚えておいてください。.
Depending on the settings and speed of your computer it could take several hours or even days, so be patient. If the program doesn’t produce any strategy for a very long time, perhaps we should switch to a higher timeframe – 30 min, 1 Hour, or make the constraints less restrictive.
3. First filter – Out of sample (OOS) check
データバンクに有望な戦略が2000個溜まったら、生成を停止してフィルタリングプロセスを開始します。.
I’ll apply the first filter – by removing all the system that have bad Out of Sample performance. I can do it quickly, just by sorting the strategies in Databank and deleting the ones that have OOS profit smaller than $3000.
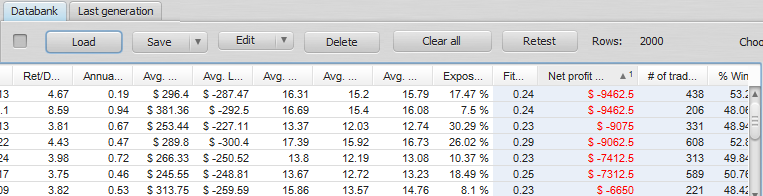
画像4 OOS Net Profit順に並べ替えられた戦略のプールを含むデータベース
This first step usually removes a big portion of strategies, so from initial 2000 candidates we are down to around 1700.
2. 第2フィルター – 再試験および2回目のOOS(規格外)確認
In this step I’ll retest all the strategies on the unknown Out of Sample period plus I’ll add test on TF data.
戦略の再テストは簡単です。データバンク内のすべての戦略を選択し、「再テスト」ボタンをクリックするだけです。これにより、すべての戦略が「再テスト」タブに移動します。また、再テストにビルド設定を使用するかどうかを確認するダイアログが表示されるので、それを承認します。
I’ll then extend the data period to the end of available data. Strategies were generated on data from 2.1.2003 to 31.12.2012, I’ll now retest the strategies on data until 31.12.2013 (one more year not used during generation) and set Out of Sample period from 31.12.2012 to 31.12.2012.
Note that this will retest the strategies on the full data, and the OOS part will show the strategy performance during the last year of the previously unused data.
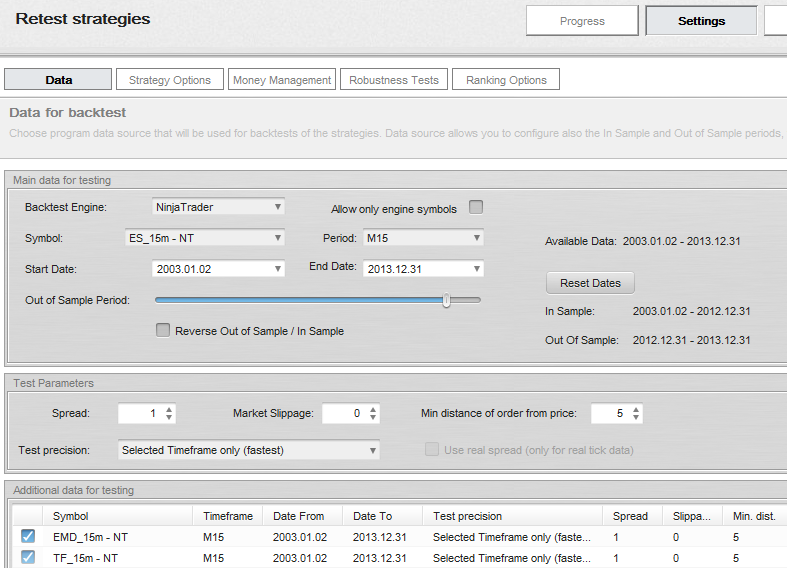
Image 5: Settings for retest
Because I have also historical data for TF I’ll add them to additional data to compare the performance on all three eminis.
The test could take some time and after it is done I’ll once again remove all the system that have bad Out of Sample performance. Again I can sort the strategies in Databank by Net Profit (OOS) and delete the ones that have OOS profit smaller than $1500.
3. Third filter – EMD, TF check
Third filter is visual – I’ll check performance of the strategies on EMD and TF symbols. I’ll go to Results -> Equity chart, switch chart to Portfolio and go through strategies one by one looking at the equity curves for EMD and TF.
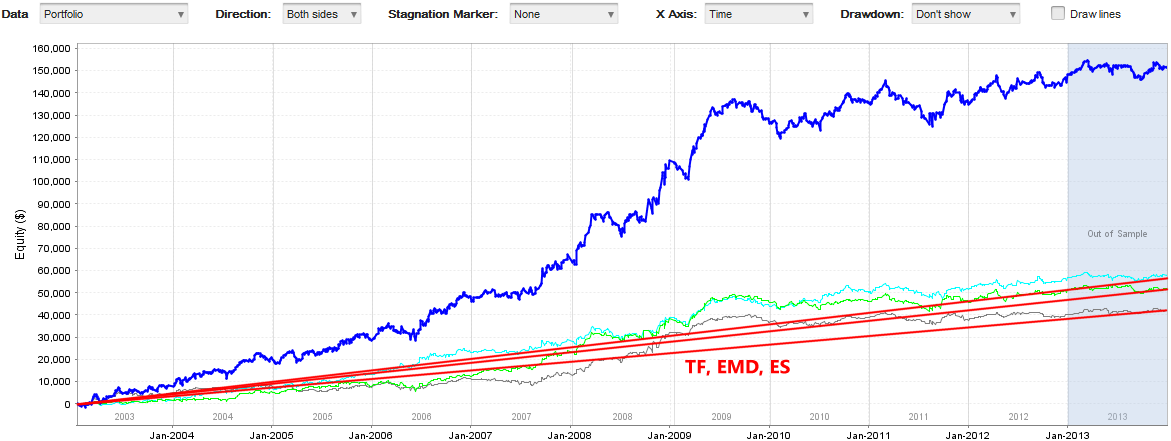
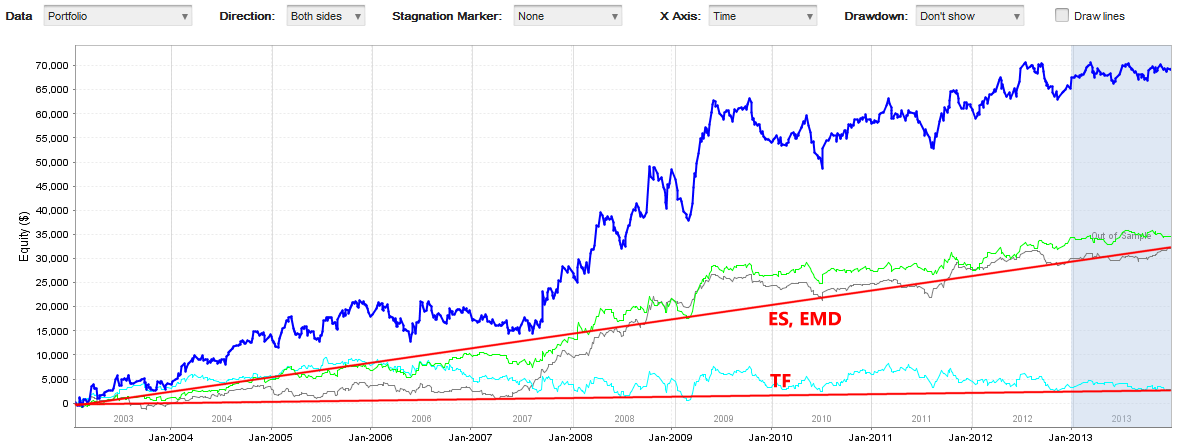
Image 6: Example of good and bad EMD / TF performance
What are we looking for? Because these eminis are highly correlated, I want the strategy to be profitable on all three symbols, just like on the first example. We can see on the second example that performance on TF is very poor compared to ES and EMD, its equity curve is not grodwing, so I’ll dismiss such strategies.
There can also be another extreme – that performance on TF and/or EMD is much better than performance on ES. This is ok, it often happens that strategies perform better on TF than on ES.
We should be not looking only at the final performance, but also to equity curves. We should dismiss all equity curves that have long periods of stagnation, or big drawdowns.
This way we can make the filter very though, we should end up with no more than 10-20 remaining top strategies for the next step.
4. 第4のフィルター – ロバストネス検定
After removing all the strategies with bad EMD / TF performance there are less than 20 strategies left that have good IS and OOS performance, as well as satisfactory performance on EMD / TF. I’ll now retest strategies again with Robustness tests and Money Management to see how each of the strategies handles small changes in inputs and to be able to compare the strategies to each other.
I’ll change money management from fixed size to fixed amount, letting every startegy risk $500 per trade. This allows for better strategies comparison, because they risk the same amount per trade.
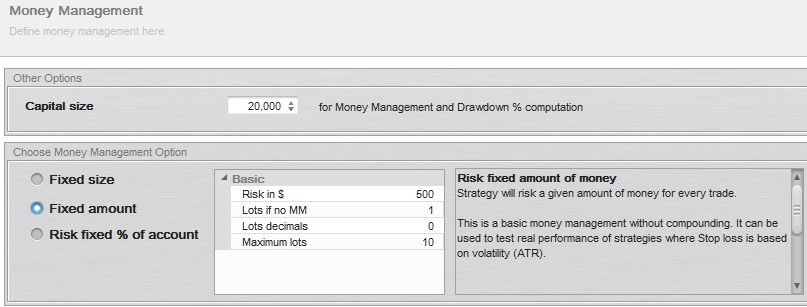
画像7:資金管理を固定額に設定する
ロバストネス(堅牢性)テストでは、少なくとも20回のシミュレーションを使用し、あらゆる種類のストレステストで戦略を検証します。ロバストネス・テストの設定後、戦略を再度テストします。.
今回はデータバンクに残っている戦略が少ないため、すぐに終わります。.
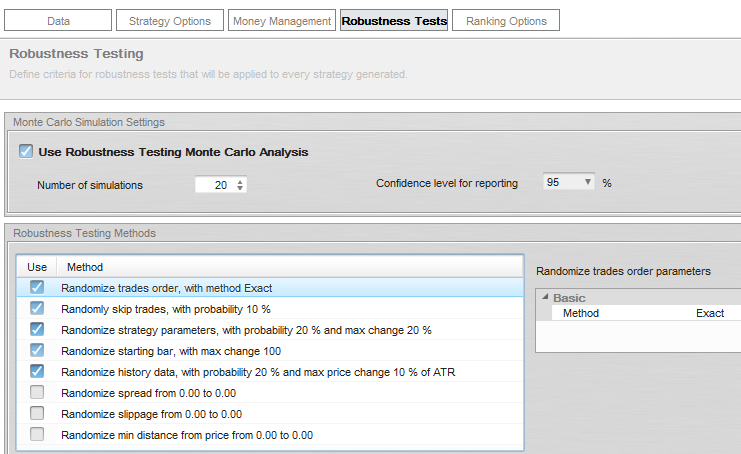
画像8:ロバスト性テスト
ロバスト性テストの評価方法
ロバスト性テストは、取引の欠落や異なる履歴データなどが存在する場合、その戦略が現実においてどのように振る舞うかを示してくれます。私は、95%の信頼水準において、Net Profitとドローダウンの値が許容範囲内にある戦略を探しています。.
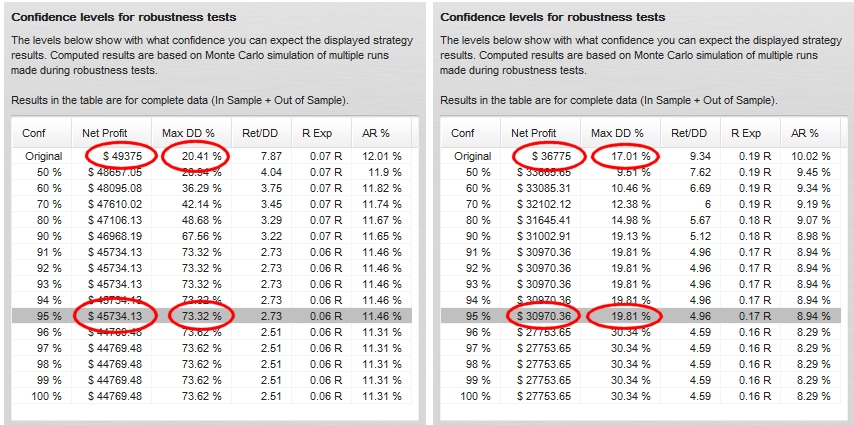
画像9:頑健性テストの結果
上記の例では、2つの戦略に対するロバスト性の結果を確認できます。左側の戦略は許容範囲内の利益を示していますが、ドローダウンは元の結果と比較して2倍以上に増加しています。.
右側の戦略も許容範囲内の利益を出しており、ドローダウンはほとんど変わりませんでした。.
このステップでは、次のロバスト性テストの対象となる最終的な戦略を1〜3個だけ選択します。.
These final strategies are selected by the best results in robustness tests, overall profitability and also simplicity – I want the strategy rules to be as simple as possible, and trading rules should make some sense.
5. 第5フィルター – ウォークフォワードマトリックス・テスト
私たちに残された戦略はわずかであり、ロバスト性のための究極のテスト、すなわちウォークフォワード・マトリックス・テストを実行することができます。WFマトリックスは、異なる実行回数と実行期間を持つウォークフォワード最適化を並べた単なるマトリックスです。.
戦略がウォークフォワードマトリックス・テストを通過した場合、それはパラメータの再最適化の助けを借りて、その戦略が 多様な市場環境に適応できる さらに、リアプティマイゼーション(再最適化)を行うことで異なる多くの期間において機能することから、この戦略が特定のデータに過剰最適化(カーブフィッティング)されていないことも確認されています。.
このWFマトリックスのテストは、戦略を恒久的に再最適化すべきかどうか、また最適な再最適化期間がどれであるかも教えてくれます。.
ウォークフォワード・マトリックス・テストは、戦略ごとに個別に実行する必要があります。まず、自分の戦略をオプティマイザーに読み込み、「ウォークフォワード・マトリックス」オプションを選択します。さらに、実行ステップ数とOOSの割合も設定します。StrategyQuantは、これらすべての組み合わせを順に処理し、戦略のウォークフォワード最適化を実行します。.
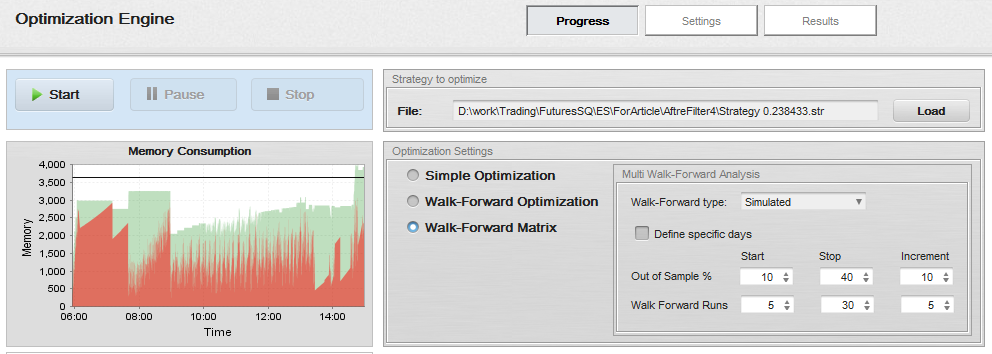
画像10:ウォークフォワード・マトリックスの設定
最適化のためのパラメータの設定
最適化を意味のあるものにするためには、最適化される戦略パラメータを設定する必要があります。各戦略は異なるロジックを使用し、異なるパラメータを持っているため、それぞれ異なる方法で最適化を設定する必要があります。.
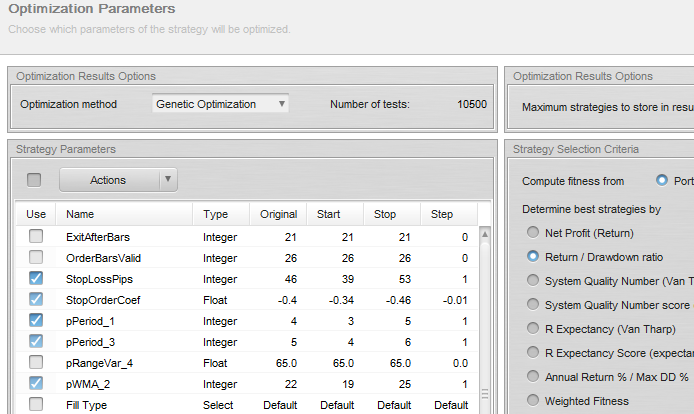
画像11:パラメータの最適化
この戦略は比較的シンプルなので、ストップロス値とトレーリングストップ係数のみを最適化します。.
すべてのパラメータを最適化する必要はありません。戦略のパフォーマンスに最も大きな影響を与えるパラメータのみで十分です。.
ウォークフォワードマトリックスの評価
最適化が完了したら、データバンク内のウォークフォワードマトリックスの結果をクリックして詳細を確認します。.
I want optimizer to give me clear answer if the strategy passed Walk-Forward optimization test, so I have to set up score criteria.
These are simple criteria that have to be true for strategy to pass the test.
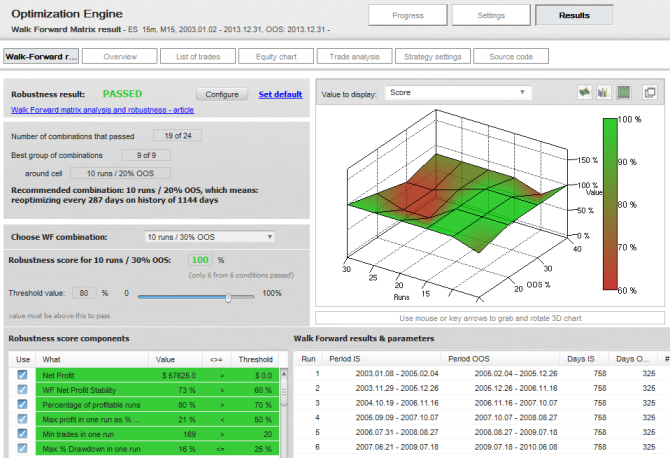
画像13:ウォークフォワード・マトリックスの結果
The final result is that the startegy passed Walk Forward matrix test for robustness. The 3D score chart shows us that 19 out of 24 combinations passed our criteria (default settings used).
この戦略は、すべての組み合わせで合格する必要はありません。私が探しているのは、ほとんどの組み合わせが合格している2×2または3×3の領域です。これが、再最適化による最良の組み合わせのグループとなります。 この場合、30%のアウトオブサンプルで10回実行した組み合わせが最良の組み合わせの一つであることがわかります。というのも、その組み合わせは、同様に合格した他の組み合わせに囲まれているからです。.
When I check the Walk-Forward optimization chart I can see that the strategy remains profitable also during reoptimization. The decrease of profitability is in line with tests we got from Monte Carlo robustness analysis, but the strategy is still profitable.
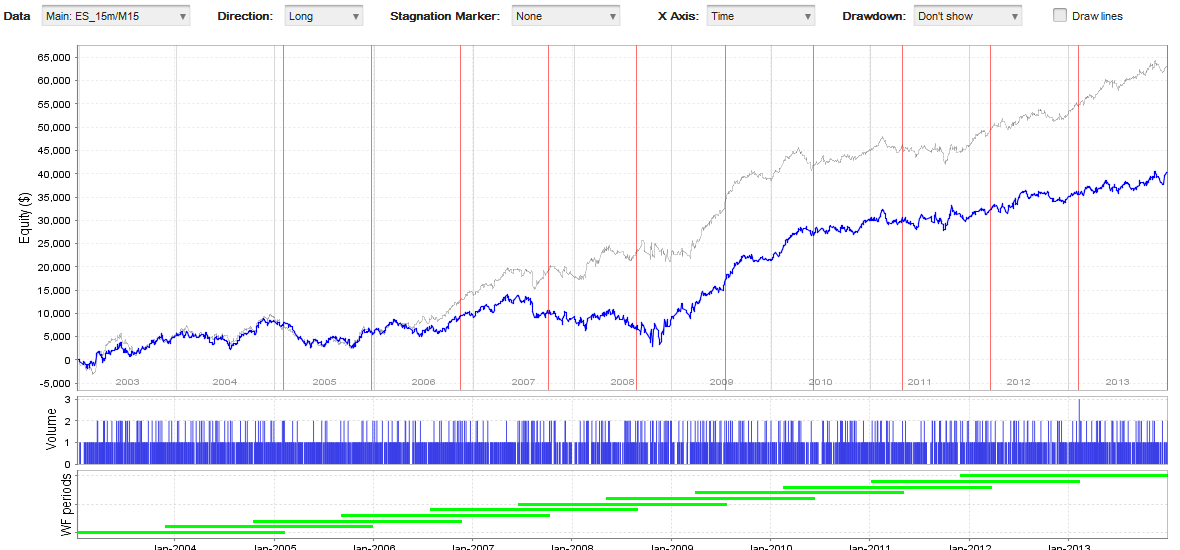
画像 14: ウォークフォワード最適化チャート
まとめ
StrategyQuantを用いた作業の全プロセスを解説したところ、そこからいくつかの興味深い新しい戦略が生まれました。.
These strateguies are just samples an dit took me less than 2 days of SQ running and about 1-2 hours of my time to find them with the use of StrategyQuant.
あなた自身で試してみたり、インスピレーションを得たり、あるいは独自のアイデアでプロセスを改善し、私たちの フォーラム.
プロセスの改善案 – ロング方向とショート方向の戦略を別々に探すことを検討できます。方向ごとに独自のダイナミクスがあり、ロングとショートで異なる戦略を用いることで、より良い結果が得られる可能性があります。.
言ってません 改善者 – パフォーマンスにまだ満足していない場合、既存の戦略のより良いバリエーションを探すことを可能にする強力なツールです。.
留意してください。ポイントは、過去データ上で完璧な戦略を見つけることではありません。それは失敗の元です。なぜなら、過剰最適化された戦略は、実際の取引において必ず失敗するからです。.
私たちの目標は、異なるデータやシンボルに対して頑健な戦略を見つけることでなければならない。なぜなら、これは市場に対する真の優位性を持っていることを意味するからだ。.


 英語
 スペイン語
 ポルトガル語
 フランス語
 イタリア語
 ドイツ語