


 英語
英語 スペイン語
スペイン語 ポルトガル語
 フランス語
フランス語 イタリア語
イタリア語 ドイツ語
ドイツ語ドキュメント
アプリケーション
Last updated on 5. 5. 2015 by Mark Fric
Quant Analyzerへようこそ
We developed Quant Analyzer (QA) to be simple and intuitive. You simply load some reports and then analyze their performance in the Analyzer.
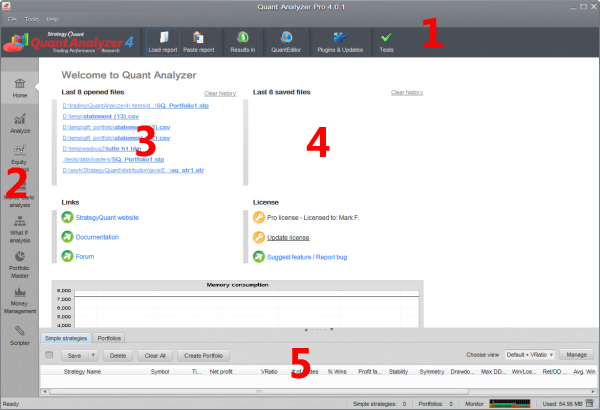
When you first start the program you can see the screen similar to the one below:
場所:
1. is the top toolbar that you can use to load and save files, start QuantEditor and check for plugins and updates
2. is the left toolbar that allows you to switch between various program modules
3. そして 4. are most recently loaded or saved files
5. is a databank – this is where you can see the loaded reports.
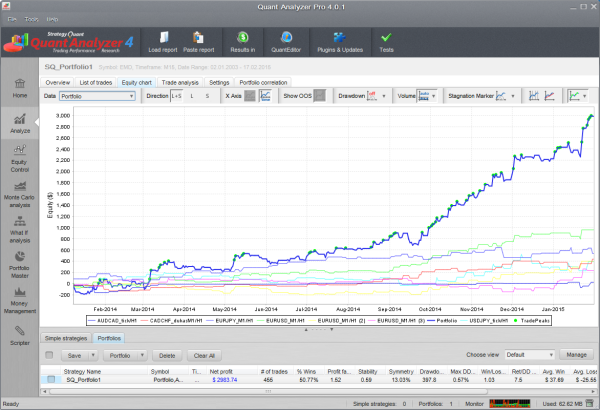
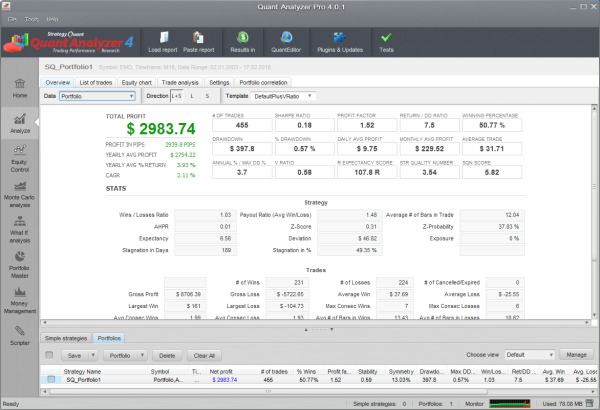
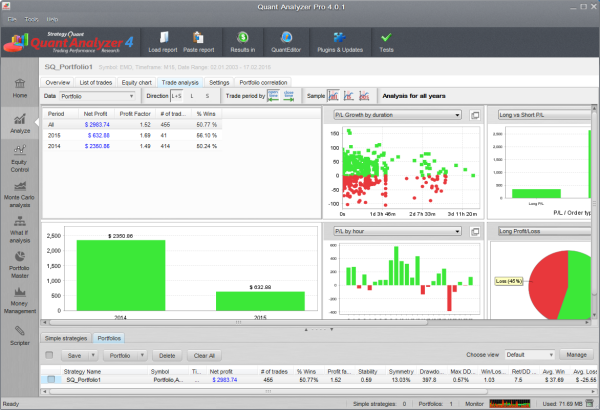
Perhaps the most often used module is Analyze.
It allows you to see the equity chart, performance statistics, trade analysis charts and much more.
EA Analyzer quick links:
拡張性
One of the biggest advantages of Quant Analyzer is extendability.
With the new version you are able to customize almost anything, including adding your own chart types, statistical values to compute, new money management types to simulate, and so on.
To learn more about how to extend Quant Analyzer check the How To examples and documentation to extending QuantAnalyzer
この記事は参考になりましたか? この記事は役に立った この記事は役に立たなかった
Fantastic tool, would be awesful if the UI can be updated a bit.
こんにちは
After importing the report into the Quant Analyzer program
The report is not added correctly and the order is displayed incorrectly
In the list of trades, it is quite clear that duplicate and incorrect orders have been added.