英語
英語 スペイン語
スペイン語 ポルトガル語
 フランス語
フランス語 イタリア語
イタリア語 ドイツ語
ドイツ語Extensive performance overview & metrics
See all the important information and metric at first glance
コンテンツへスキップ | メインメニューへ移動 | 検索に移動
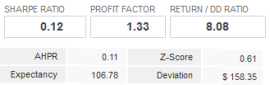
Metrics such as Sharpe Ratio, Return/Drawdown ratio, AHPR, Z-score, Deviation, Expectancy, Strategy Quality Number, Monthly and Annual % return, Payout ratio, Win/Loss ratio, Z-Probability, Exposure, Stagnation in days and % and many more.
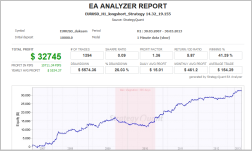
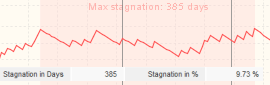
What was the longest time it took to create new equity high?
You can see results of each month of every year separately in a table
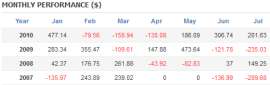
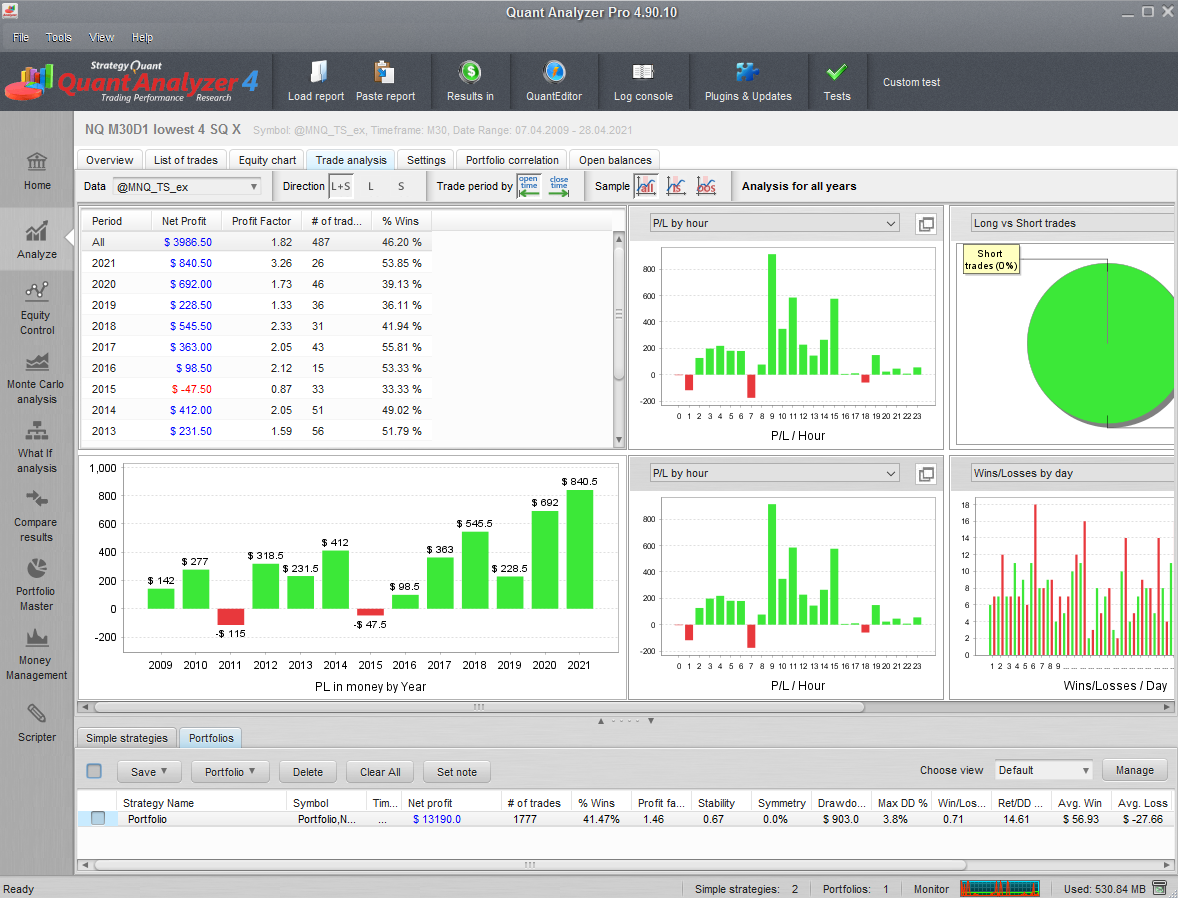
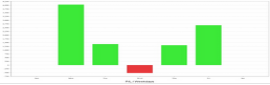
Easily see in which days and hours are profitable for the strategy
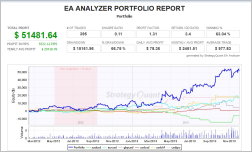
Combine results of multiple strategies and create a clearly arranged report from the entire portfolio
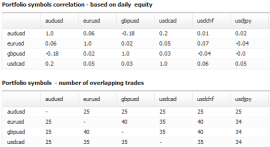
Calculate correlation of strategies in the portfolio based on daily, weekly, or monthly results
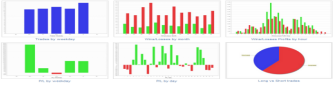
Trades, profit and loss, number of trades, number of profitable and loss trades – you can see all these in the statistics over hours, days of the week, days, months, years

QuantAnalyzer