Welcome to today’s blog post! We’re excited to dive into the new Is Greater/Is LowerAdaptive comparison block , an innovative extension of the previous range-based adaptive block. Additionally, we’ll introduce a powerful new indicator, Autocorrelation , now available on the StrategyQuant Sharing Server. To wrap up, we’ll share our vision for 2025, focusing on expanding the Strategy Client with custom snippets and enhanced functionality. Let’s get started!
IsGreater/IsLowerAdaptive Block
Core Function
その IsGreater Is/Lower Adaptive comparison block does one main thing: it checks if one indicator is greater than another, but only generates a signal if similar situations were profitable in the past.
This comparison block analyzes the entire length of the signal, from the moment it is generated until it is no longer valid. For example, if we analyze a signal where the RSI is greater than 50, this adaptive block evaluates signals where the RSI was above 50. This number of signals can be limited by settin Trades Look Back Situations where the RSI was below 50 are ignored, allowing the block to assess the overall quality of the signal.
The key difference between the Is Greater Adaptive Block / Is Lower Adaptive Block そして、 Crosses Above Adaptive / Crosses Below Block lies in their approach. The Is Greater Adaptive/ Is Lower Adaptive Blocks evaluates the entire signal duration, while the Crosses Above Adaptive /Crosses Below Adaptive Blocks analyzes events after a specific crossover within a defined number of bars.
How the Is Greater Adaptive/Is Lower Adaptive Mechanism Works
その Is Greater Adaptive そして Is Lower Adaptive mechanisms follow a structured process to evaluate trade signals and adapt to market conditions. The process consists of four key steps:
1. Basic Signal Detection
The first step is identifying a basic Is Greater または Is Lower event. This occurs when one indicator crosses above or below another. Examples include:
- The current closing price is above a 20-period moving average.
- The RSI(14) value crosses above 50.
These events serve as the initial signals to be evaluated further.
2. Historical Performance Evaluation
Once a crossover event is detected, the system evaluates its historical performance. It analyzes how similar signals have performed in past trades (X-trades). This step acts as a “backtest within a backtest,” helping to determine the potential reliability of the current signal based on historical data.
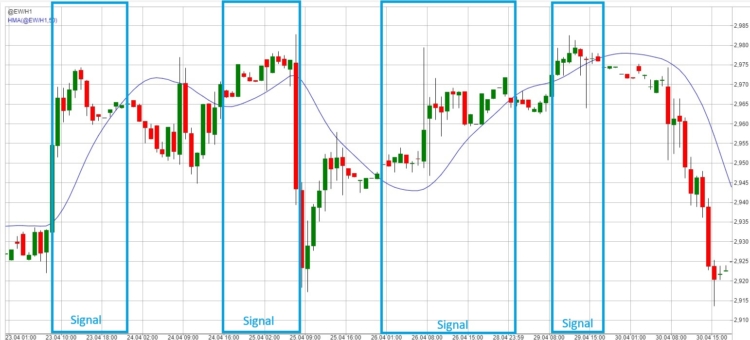
In the image above, we have a graphical representation of how signals are defined when using isGreaterAdaptive . A signal can be considered a situation where Close > Moving Average .
3. User-Defined Metrics and Thresholds
The system then compares the historical performance against user-defined metrics and thresholds. Traders can configure various evaluation criteria, such as:
- Proフィット係数: The ratio of winning trades to losing trades.
- Cumulative %Performance: The overall return percentage achieved in past instances of the signal.
These metrics ensure that only signals meeting the trader’s expectations are considered valid.
4. Final Decision: Adapting to Market Conditions
Finally, the system assesses whether the current market conditions resemble those in which the signal has historically performed well. If the conditions align and the metrics meet the specified thresholds (eg, a profit factor greater than 1.5), the trade is confirmed. Otherwise, the system refrains from entering a trade, reducing the likelihood of false signals.
This adaptive approach allows traders to leverage historical data and real-time market analysis to make more informed trading decisions.
Key Settings
その後、クロスオーバーのパフォーマンスがユーザー定義の閾値と比較されます。ユーザーは次のようなさまざまな評価指標を選択できます。

- Methodology
- Profit Factor: Wins divided by losses.
- Cumulative % Performance: Overall return percentage.
- TradesLookBack: Number of past trades to analyze (eg, 10 means analyzing the last 10 signals).
- パフォーマンスしきい値 Minimum performance requirement (eg, a Profit Factor of 1.5 means 1.5x more wins than losses).
- TS Max Bars Back: Parameter used exclusively for backtesting on the TradeStation or MultiCharts engine. This parameter must match the exact value set directly in the TradeStation or MultiCharts TS Max Bars Back setting.
結果
- Generates fewer signals compared to standard comparisons.
- Filters signals based on historical success.
- Adapts to changing market conditions.
ブロックのインポート スニペットのインポート方法については、ドキュメントセクションをご覧ください。 ここ
After successful import you can use the new comparison blocks in:
ビルダー
ビルダーでは、「ビルダー / ブロック」からこのブロックを有効にできます。ブラインドデータマイニングを行う際は、方向性がなくシグナルの平均的な絶対的強度を計算する「平均パフォーマンス(Avg Performance)」指標の使用が推奨されます。設定における詳細度や具体性は、各ユーザーの判断に委ねられます。.
AlgoWizard – カスタムブロック
StrategyQuant Xのカスタムブロックを使用すれば、トレーダーはコーディングを行うことなく、自身の取引戦略に合わせた独自の構成要素を作成できます。これらのブロックを活用することで、ユーザーの要件に合わせた特定の条件、指標、またはロジックを定義することが可能です。 作成されたカスタムブロックは、StrategyQuantのビジュアル戦略ビルダーであるAlgoWizardにシームレスに統合され、複雑で適応性の高い取引戦略を構築することができます。.
カスタムブロックは、インジケーターの期間、プロフィットファクター、勝率などの主要な指標をパラメータ化できるようにすることで柔軟性を高め、戦略の挙動に対するより優れたコントロールを提供します。要するに、カスタムブロックはより正確で、動的で、洗練された
現在、この条件に基づいていくつかのカスタムブロックを用意しました。こちらからダウンロードできます リンク 以下の手順に従ってインポートします。.
AlgoWizard – テンプレート
これは、今後の記事でより詳しく解説する高度なトピックです。カスタムブロックとランダムグループを組み合わせることで、プロトタイプの戦略を作成し、特定のタイプの戦略を検索しつつその適応性を維持するようSQXに指示することができます。.
インジケーターは以下のプラットフォームに対応しています:MT4/MT5/Tradestation/ Multicharts。. You can download it ここ .
Understanding the Autocorrelation Indicator
その 自己相関インジケーター 金融市場における繰り返しのパターンや循環的な挙動を特定するための、テクニカル分析で用いられる強力な統計ツールです。その機能、実装、および応用の概要は以下の通りです。.
自己相関とは何ですか?
自己相関は、時系列データとそのデータを一定期間(ラグ)ずらした自己との間の類似度を測定するものです。簡単に言えば、今日の価格変動が、過去の特定の期間の変動に関連しているかどうかを判断するものです。.
- +1 完全な正の相関。.
- 0 相関なし。.
- -1 完全な負の相関。.
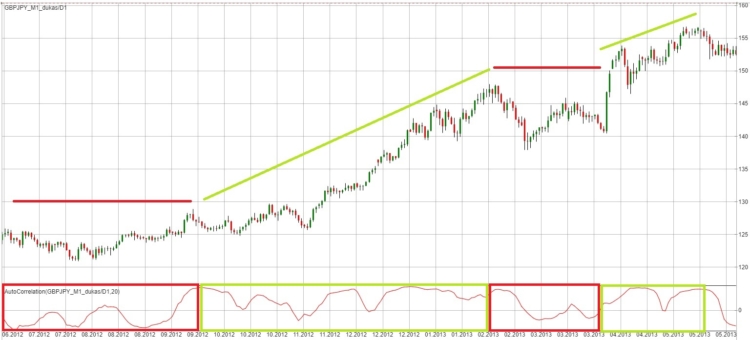
主なメリットと取引への応用
- マーケットサイクル 平均回帰戦略に向けて、周期的なパターンを特定し、価格の値動きを予測する。.
- 勢い 市場のトレンドの強さを測定し、レジームの変化を検出します。.
- 戦略策定 リスク管理機能を備えたシステマチックなトレーディング戦略を容易にします。.
ベストプラクティス
- ラグ選択
- 短いラグ(1〜5):短期的な関係。.
- 中程度の遅延(10-20):中間サイクル。.
- 長いラグ(20以上):長期パターン。.
- 信号解釈
- 強い正の自己相関:トレンド継続の可能性が高い。.
- 強い負の自己相関:反転の可能性。.
- ゼロに近い自己相関:ランダムな価格変動。.
- 他の指標との組み合わせ
- 確認用のトレンド系指標.
- ボラティリティ指標.
- 意思決定支援のための出来高分析.
このインジケーターには、異なる市場シナリオに対応する3つのカスタムブロックが含まれています。
- 自己相関_強いトレンド このカスタムブロックは、自己相関が市場のトレンドを示唆している状況を特定します。.
- 自己相関_ランダム価格 このブロックは、価格がランダムに見える期間を強調表示しており、理論的には取引にあまり有利ではない時期を示しています。.
- 自己相関平均回帰 このブロックは平均回帰期間を検出し、価格がレンジ内で変動しているシグナルを出します。.
The Autocorrelation indicator provides valuable insights into market behavior but should always be used as part of a comprehensive trading strategy.
Indicator is implemented for: MT4/MT5/Tradestation/ Multicharts. You can download it ここ .
Plans for 2025: New Snippets and Features
We have several exciting features planned for the upcoming year, including:
- Is Above Moving Average/ Is Below Moving Average comparison block, which allows you to create and smooth indicators using the moving average.
- Divergence Analysis Snippet : Implemented as a Comparison Block.
- Statistical Process Control Comparison Blocks
- Data Drift Detection Blocks : Prevent trading during regime changes.
- CUSUM Monitoring : Detect small shifts.
- EWMA : Track gradual changes.
- Kolmogorov-Smirnov Regime Indicator
- Page-Hinkley Test Indicator
- Drift Detection Method (DDM) Indicator
- Earth Mover’s Distance Indicator
We’re committed to expanding the Strategy Client’s capabilities, offering tools that empower traders to navigate dynamic markets efficiently.



 英語
 スペイン語
 ポルトガル語
 フランス語
 イタリア語
 ドイツ語





Excellent article Ivan !!
Very interesting article. But I have 2 comments: 1) During the generation of strategies in SQX 141 and 142, the generation is interrupted due to errors: a) Error: java.lang.NullPointerException finished in 0.00 s. b) Error: com.strategyquant.tradinglib.strategy.xml.XmlStrategyException: cannot create strategy from XML! Error while parsing rule ‘Trading signals’ – Cannot find block ‘IsGreaterAdaptive’ at SQ.Internal.Rule.initialize(Rule.java:169) at SQ.Internal.Rule.newInstance(Rule.java:130) at SQ.Internal.StrategyEvent.parseXml(StrategyEvent.java:107) at SQ.Internal.StrategyEvent.<init>(StrategyEvent.java:58) at SQ.Internal.XmlStrategy.parseXml(XmlStrategy.java:264) at SQ.Internal.XmlStrategy.callOnIn finished in 0.00 s. and the generation must be restarted. 2) Why these blocks (including other scripts etc) are not automatically included in the new version of SQX. I’m tired of manually importing them again into… 続きを読む »