Welcome to today’s blog post! We’re excited to dive into the new Is Greater/Is LowerAdaptive comparison block , an innovative extension of the previous range-based adaptive block. Additionally, we’ll introduce a powerful new indicator, Autocorrelation , now available on the StrategyQuant Sharing Server. To wrap up, we’ll share our vision for 2025, focusing on expanding the Strategy Client with custom snippets and enhanced functionality. Let’s get started!
IsGreater/IsLowerAdaptive Block
Core Function
The IsGreater Is/Lower Adaptive comparison block does one main thing: it checks if one indicator is greater than another, but only generates a signal if similar situations were profitable in the past.
This comparison block analyzes the entire length of the signal, from the moment it is generated until it is no longer valid. For example, if we analyze a signal where the RSI is greater than 50, this adaptive block evaluates signals where the RSI was above 50. This number of signals can be limited by settin Trades Look Back Situations where the RSI was below 50 are ignored, allowing the block to assess the overall quality of the signal.
The key difference between the Is Greater Adaptive Block / Is Lower Adaptive Block and the Crosses Above Adaptive / Crosses Below Block lies in their approach. The Is Greater Adaptive/ Is Lower Adaptive Blocks evaluates the entire signal duration, while the Crosses Above Adaptive /Crosses Below Adaptive Blocks analyzes events after a specific crossover within a defined number of bars.
How the Is Greater Adaptive/Is Lower Adaptive Mechanism Works
The Is Greater Adaptive and Is Lower Adaptive mechanisms follow a structured process to evaluate trade signals and adapt to market conditions. The process consists of four key steps:
1. Basic Signal Detection
The first step is identifying a basic Is Greater or Is Lower event. This occurs when one indicator crosses above or below another. Examples include:
- The current closing price is above a 20-period moving average.
- The RSI(14) value crosses above 50.
These events serve as the initial signals to be evaluated further.
2. Historical Performance Evaluation
Once a crossover event is detected, the system evaluates its historical performance. It analyzes how similar signals have performed in past trades (X-trades). This step acts as a “backtest within a backtest,” helping to determine the potential reliability of the current signal based on historical data.
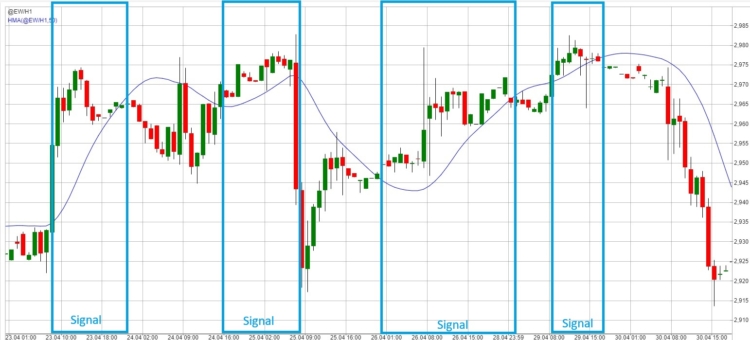
In the image above, we have a graphical representation of how signals are defined when using isGreaterAdaptive . A signal can be considered a situation where Close > Moving Average .
3. User-Defined Metrics and Thresholds
The system then compares the historical performance against user-defined metrics and thresholds. Traders can configure various evaluation criteria, such as:
- Profit Factor: The ratio of winning trades to losing trades.
- Cumulative %Performance: The overall return percentage achieved in past instances of the signal.
These metrics ensure that only signals meeting the trader’s expectations are considered valid.
4. Final Decision: Adapting to Market Conditions
Finally, the system assesses whether the current market conditions resemble those in which the signal has historically performed well. If the conditions align and the metrics meet the specified thresholds (eg, a profit factor greater than 1.5), the trade is confirmed. Otherwise, the system refrains from entering a trade, reducing the likelihood of false signals.
This adaptive approach allows traders to leverage historical data and real-time market analysis to make more informed trading decisions.
Key Settings
The performance of the crossover is then compared against user-defined thresholds. The user can choose different evaluation metrics, such as:

- Methodology
- Profit Factor: Wins divided by losses.
- Cumulative % Performance: Overall return percentage.
- TradesLookBack: Number of past trades to analyze (eg, 10 means analyzing the last 10 signals).
- Performance Threshold: Minimum performance requirement (eg, a Profit Factor of 1.5 means 1.5x more wins than losses).
- TS Max Bars Back: Parameter used exclusively for backtesting on the TradeStation or MultiCharts engine. This parameter must match the exact value set directly in the TradeStation or MultiCharts TS Max Bars Back setting.
Results
- Generates fewer signals compared to standard comparisons.
- Filters signals based on historical success.
- Adapts to changing market conditions.
Importing the Block : A guide on how to import the snippet can be found in the Docs section here
After successful import you can use the new comparison blocks in:
Builder
In the Builder, you can enable this block under Builder / Blocks. When conducting blind datamining, it’s recommended to use the Avg Performance metric, which is non-directional and calculates the average absolute strength of a signal. The level of detail and specificity in the settings is up to each user.
AlgoWizard – Custom Blocks
Custom blocks in StrategyQuant X allow traders to create personalized building blocks for their trading strategies without needing to code. These blocks can be used to define specific conditions, indicators, or logic tailored to the user’s requirements. Once created, custom blocks can be seamlessly integrated into AlgoWizard, StrategyQuant’s visual strategy builder, to build complex and adaptive trading strategies.
Custom blocks enhance flexibility by allowing you to parameterize key metrics like indicator periods, profit factors, and win percentages, providing more control over your strategy’s behavior. In summary, custom blocks enable more precise, dynamic, and sophisticated
For now, I have prepared several custom blocks based on this condition. You can download them using this link and import them by following these steps.
AlgoWizard – Templates
This is a more advanced topic that we will cover in greater depth in an upcoming article. By combining custom blocks and random groups, you can create a prototype strategy and instruct SQX to search for specific types of strategies and maintain its adaptiveness.
Indicator is implemented for: MT4/MT5/Tradestation/ Multicharts. You can download it here .
Understanding the Autocorrelation Indicator
The Autocorrelation indicator is a powerful statistical tool used in technical analysis to identify repeating patterns and cyclic behavior in financial markets. Here’s an overview of its functionality, implementation, and applications.
What is Autocorrelation?
Autocorrelation measures the degree of similarity between a time series and a lagged version of itself. Simply put, it determines if today’s price movements relate to movements from a specific number of periods ago.
- +1 : Perfect positive correlation.
- 0 : No correlation.
- -1 : Perfect negative correlation.
Key Benefits and Trading Applications
- Market Cycles : Identifies recurring patterns and predicts price movements for mean-reversion strategies.
- Momentum : Measures market trend strength and detects regime changes.
- Strategy Development : Facilitates systematic trading strategies with risk management.
Best Practices
- Lag Selection
- Short lags (1-5): Short-term relationships.
- Medium lags (10-20): Intermediate cycles.
- Long lags (20+): Long-term patterns.
- Signal Interpretation
- Strong positive autocorrelation: Likely trend continuation.
- Strong negative autocorrelation: Potential reversal.
- Near-zero autocorrelation: Random price movement.
- Combining with Other Indicators
- Trend indicators for confirmation.
- Volatility measures.
- Volume analysis for decision support.
The indicator includes three custom blocks that address different market scenarios:
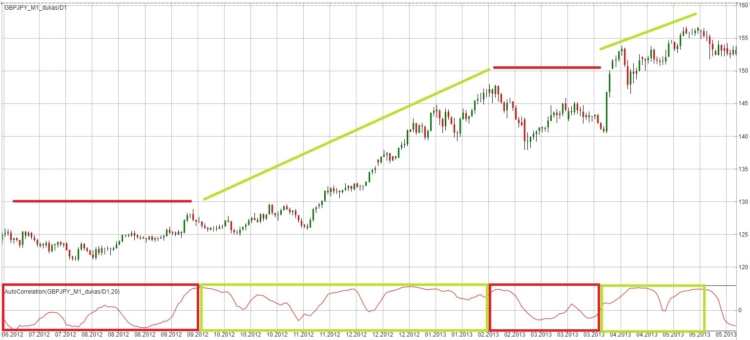
- AutoCorrelation_StrongTrend : This custom block identifies situations where autocorrelation suggests that the market is trending.
- AutoCorrelation_RandomPrices : This block highlights periods when prices appear random, which are theoretically less favorable for trading.
- AutoCorrelation_MeanReversion : This block detects mean-reversion periods, signaling times when the price oscillates within a range.
The Autocorrelation indicator provides valuable insights into market behavior but should always be used as part of a comprehensive trading strategy.
Indicator is implemented for: MT4/MT5/Tradestation/ Multicharts. You can download it here .
Plans for 2025: New Snippets and Features
We have several exciting features planned for the upcoming year, including:
- Is Above Moving Average/ Is Below Moving Average comparison block, which allows you to create and smooth indicators using the moving average.
- Divergence Analysis Snippet : Implemented as a Comparison Block.
- Statistical Process Control Comparison Blocks
- Data Drift Detection Blocks : Prevent trading during regime changes.
- CUSUM Monitoring : Detect small shifts.
- EWMA : Track gradual changes.
- Kolmogorov-Smirnov Regime Indicator
- Page-Hinkley Test Indicator
- Drift Detection Method (DDM) Indicator
- Earth Mover’s Distance Indicator
We’re committed to expanding the Strategy Client’s capabilities, offering tools that empower traders to navigate dynamic markets efficiently.

 Tomas Vanek

Excellent article Ivan !!
Very interesting article. But I have 2 comments: 1) During the generation of strategies in SQX 141 and 142, the generation is interrupted due to errors: a) Error: java.lang.NullPointerException finished in 0.00 s. b) Error: com.strategyquant.tradinglib.strategy.xml.XmlStrategyException: cannot create strategy from XML! Error while parsing rule ‘Trading signals’ – Cannot find block ‘IsGreaterAdaptive’ at SQ.Internal.Rule.initialize(Rule.java:169) at SQ.Internal.Rule.newInstance(Rule.java:130) at SQ.Internal.StrategyEvent.parseXml(StrategyEvent.java:107) at SQ.Internal.StrategyEvent.<init>(StrategyEvent.java:58) at SQ.Internal.XmlStrategy.parseXml(XmlStrategy.java:264) at SQ.Internal.XmlStrategy.callOnIn finished in 0.00 s. and the generation must be restarted. 2) Why these blocks (including other scripts etc) are not automatically included in the new version of SQX. I’m tired of manually importing them again into… Read more »