


 英語
 スペイン語
 ポルトガル語
 フランス語
 イタリア語
 ドイツ語
help – SQ backtest performance diff to multicharts
3件の返信

こんにちは
I recently purchased SQ and I am still learning slowly how the system works. I am using multicharts as my trading platform.
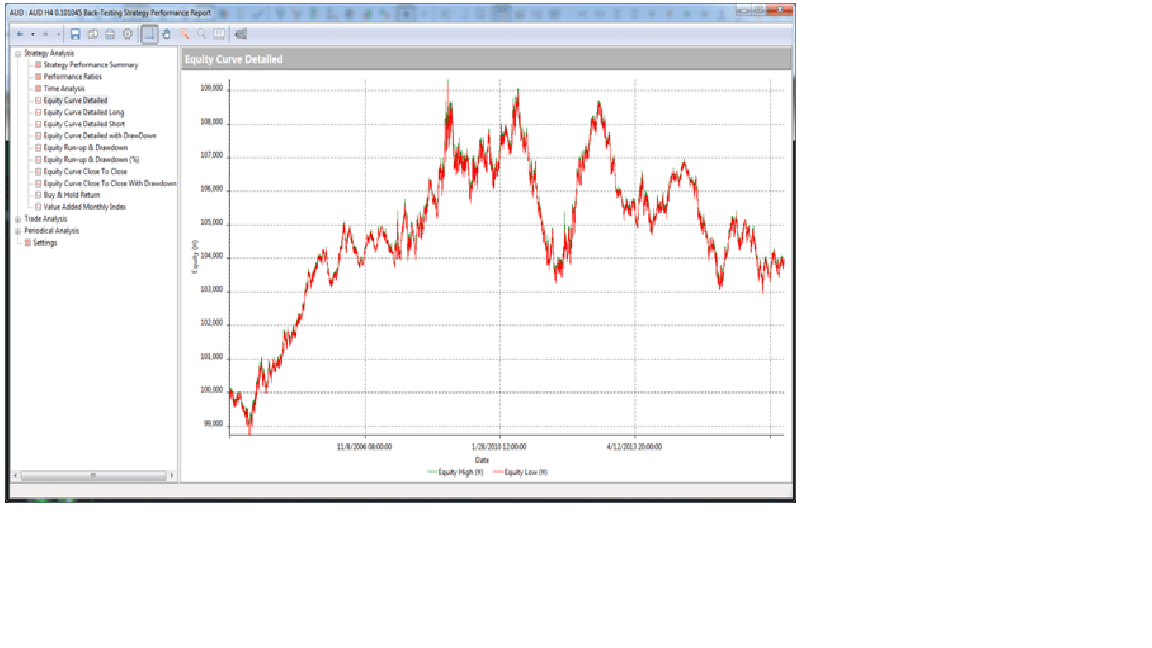
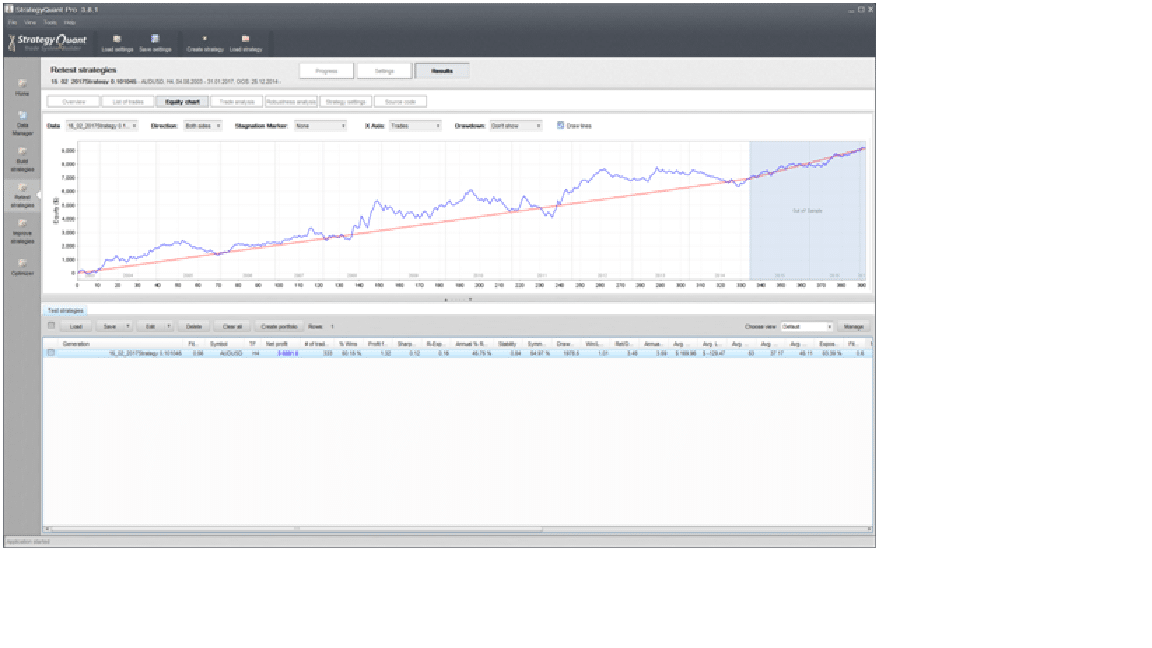
I produced a strategy via random generation without going further into robustness test or WF analysis. Due to my curiosity, I copied/pasted the strategy’s tradestation code onto multicharts and the equity chart looks totally different to the one SQ displayed.
Could someone please guide me what possibly went wrong?
here is what I did:
1. Tick Downloader : I downloaded AUDUSD M1 from 2003-2017
2. Exported database to SQ with below settings
- timezone = UTC + 1
- 1 minute data
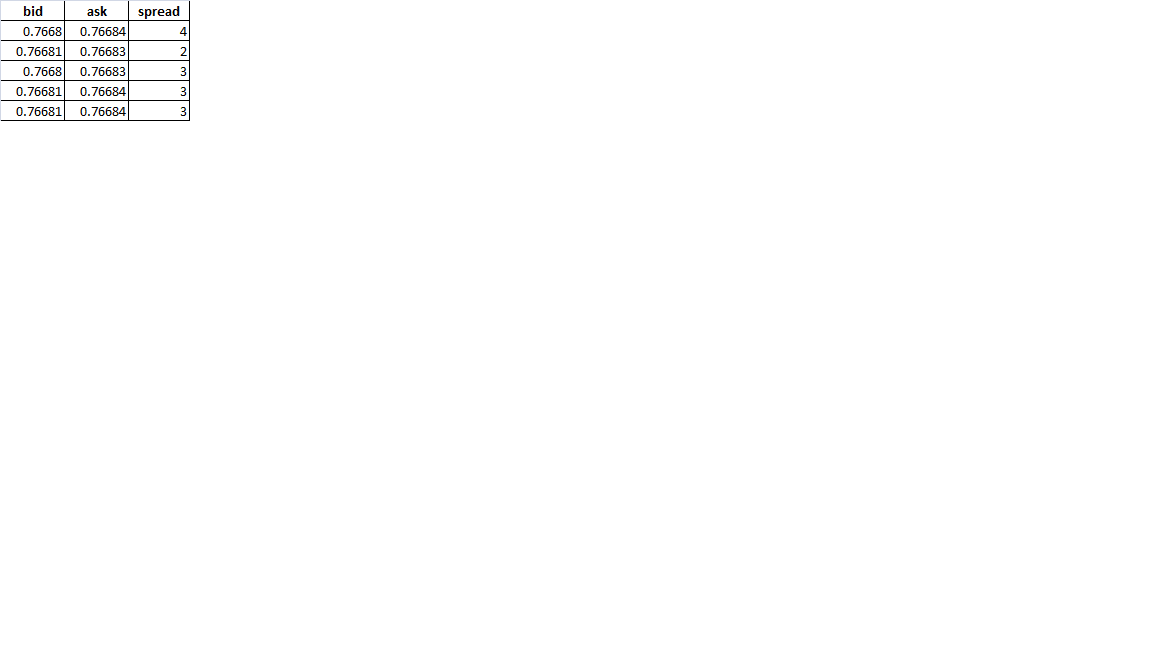
3. SQ data manager tab, i used pip/tick step = 0.00001 and pip/tick size = 0.001 with default spread = 3 since i have checked IB’s bid/ask spread is averaged ~3 (pls correct me if i am wrong)
4. double checked multichart’s quotemanager timezone which includes sunday evening session
5. in SQ build strategy tab
- selected Random Generation with in sample 2003-2014 and OOS 2014-2017
- spread =3 ; market slippage = 0
- unchecked robustness test & fixed size = 1
strategy attached. would appreciate if some body can help me get through this learning phase.
ありがとうございます!
 MC chart.png
 SQ chart.png
 bid ask.png
0

Hello,,
if you look at trade lists are the trade entry and exit times the same or different?
You use different data in SQ and MC. You should rather use and develop a strategy on IB data to have better match
0
Tomas262
It took me a while to come back as I have been talking to IB on how to download their historical data.
The entry and exit times were obviously different on MC. In fact, it just look totally wrong and I am not sure where/how to investigate.
So I guess you were probably right about the ‘data source’. I used dukascopy data for SQ strategy generation, another historical data provider for the MC and will be using IB for execution so I guess this would create a bit of issue here, but I am surprised how different the performance could be with different data source on same currency pairs.
As you suggested, going forward I am looking to try develop strategies based on IB historical data. Therefore, first I need to understand thoroughly the data format of the file required.
A few questions:
1) What format does SQ use to import data ? (i.e. what are the columns) I have read a few posts from the Forum that SQ uses
(Date; Time; Ask; Bid; AskVol; BidVol), but I would like to confirm from you.
2) If the data that I download from IB API is in different format ( e.g. Date; Time; Open; High; Low; Close; Volume) how can i convert this into SQ required format?
3) I also noticed that the SQ Tick Downloader create files in (Date; Time; O, H, L, C, V) format, may I ask how are these data being converted for SQ? Do you mind to provide me more details.
ありがとう
0
こんにちは,
in SQ you either work with tickdata or “selected timeframe” data like 30 min, or 240 min etc.
1) yes, this the tickdata format for the MetaTrade engine
2) yes, you do not need to have tick data you can use 30 minute bars for example but once you import this type of data you will get only “selected timeframe” testing precision
3) as explained above
0
3件の返信を表示中 - 1 - 3件目 (全3件中)