


 英語
 スペイン語
 ポルトガル語
 フランス語
 イタリア語
 ドイツ語
連続した負けと勝の分散分析のヒストグラム
10件の返信

Greetings,
Would anybody be kind enough to code a snippet to be able to see through histogram or table the dispersion of win/loss count please?
The info would be available in the analysis section of the str loaded into QA.
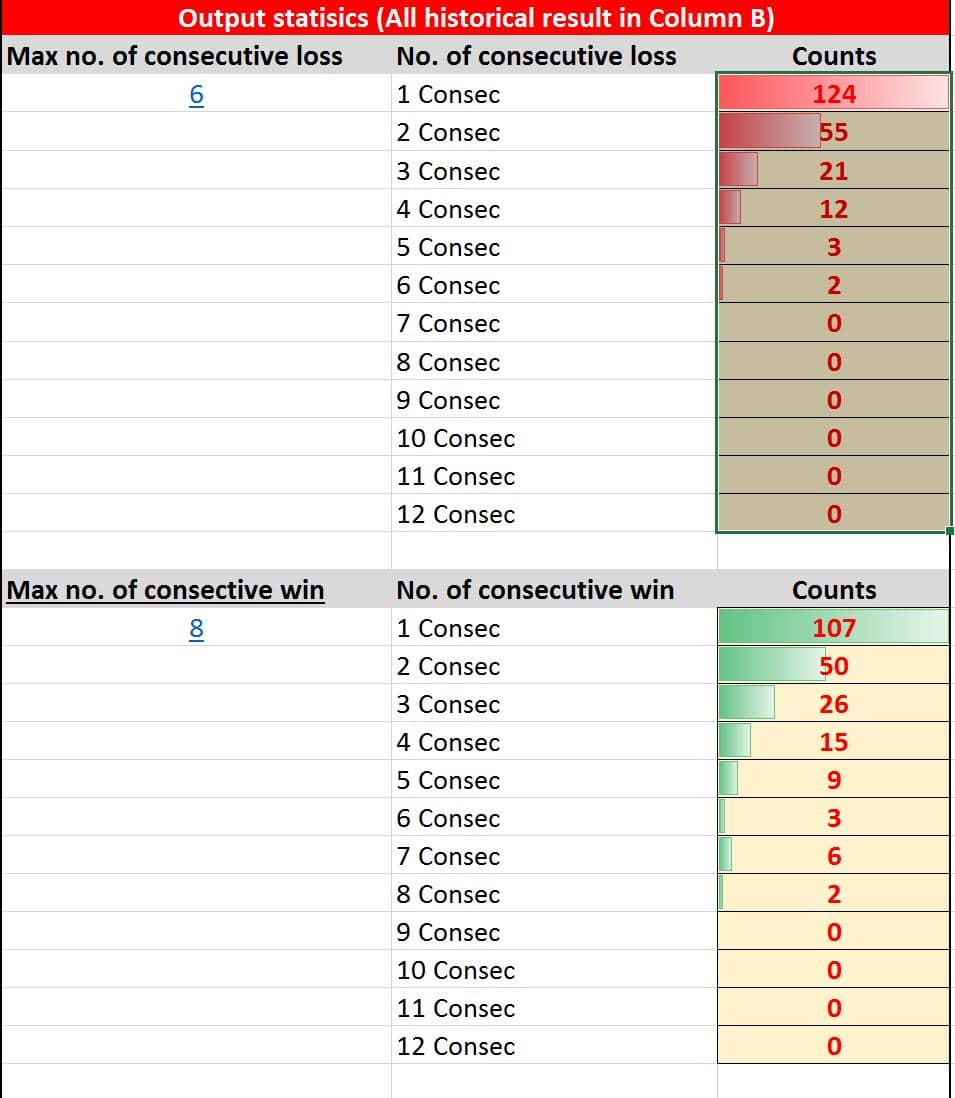
The output to be generated being as below:
example of output in the picture attached please.
Is that doable with a snippet?
Thanks a million time for whomever can do it!
よろしくお願いいたします。,
Lucca
 cons.JPG
違うことを考えよう
0
Greetings,Would anybody be kind enough to code a snippet to be able to see through histogram or table the dispersion of win/loss count please?
The info would be available in the analysis section of the str loaded into QA.
The output to be generated being as below:
example of output in the picture attached please.
Is that doable with a snippet?
Thanks a million time for whomever can do it!
よろしくお願いいたします。,
Lucca
Then the second stage would be to develop a Whatif function to exclude/change position sizing of the trades based on consecutive loss/wins, at end of sequence.
Thanks again.
違うことを考えよう
0

This feature would be great !
0

クローネックス / イヴァン・フーデツ
9年前 #143257
Ill doit byt need som time
Odoslané z G3121 pomocou Tapatalku
0

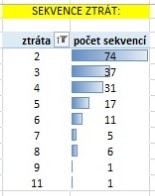
this feature will shift our trading to an another level…histogram of consec losses from whole backtest, thats what i am looking for
 sekvence.jpg
利益を上げるアルゴトレーダーになりたいですか?私たちは2014年序盤からStrateQuantソフトウェアを使い始めました。現在では、あらゆるタイプの市場に対応するEA構築に関する膨大なノウハウを持っています。私たちはこのノウハウ、アプリ、ツール、そしてすべての最終的な戦略をリアル・トレーダーの皆様と共有しています。参加したい方は、以下にご記入ください フォーム.
0
Ill doit byt need som time
Odoslané z G3121 pomocou Tapatalku
Thank you, I’ll throw the ball back whenever I have opportunity mate,
違うことを考えよう
0

Wish that would be a feature in SQ4 also 🙂
0

こんにちは,
I have added a request for this for developers to add wins/losses streak (frequency) analysis
0
Hello Tomas, do you mean in Sq4 or QA?
Sent from my A1601 using Tapatalk
違うことを考えよう
0
Hello clonex, just wondering how your work was developing, and if you had an idea when the feature you kindly proposed to develop would be ready?
‘‹Thanks again a million times!
違うことを考えよう
0
we have talked here many times about the analysis of consecutive losses and have a plan to do a histogram to Quant Analyzer which can show us very quickly hows the consecutive losses behave at each strategy
i have been waiting too long so i purchased this for me – if anyone here interested in such a thing, send a PM or email [email protected], we can discuss
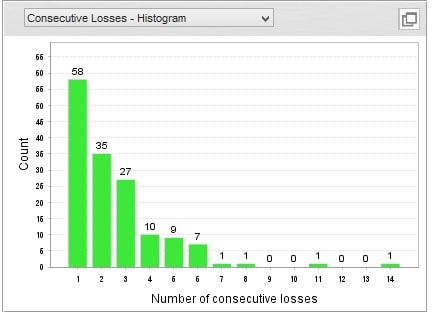 histogram of consec losses.jpg
For this particular strategy, I see that it had 14 consecutive losses (it was the extreme – BE is counted as a loss) … the losses are most changing in sequence 3 and 4, so the optimal is to wait for 5 or 6 consecutive losses, then you can statistically expect a profit period … and that’s it
i have also some new columns where i can see everything what i want to see in one view – very qucikly, i could sort by every column, etc.
 new QA columns.jpg
利益を上げるアルゴトレーダーになりたいですか?私たちは2014年序盤からStrateQuantソフトウェアを使い始めました。現在では、あらゆるタイプの市場に対応するEA構築に関する膨大なノウハウを持っています。私たちはこのノウハウ、アプリ、ツール、そしてすべての最終的な戦略をリアル・トレーダーの皆様と共有しています。参加したい方は、以下にご記入ください フォーム.
0
10件の返信を表示中 - 1 - 10件目 (全10件中)