Consecutive loss and win dispersion analysis histogram
10 replies

Gui
6 years ago #116989
Greetings,
Would anybody be kind enough to code a snippet to be able to see through histogram or table the dispersion of win/loss count please?
The info would be available in the analysis section of the str loaded into QA.
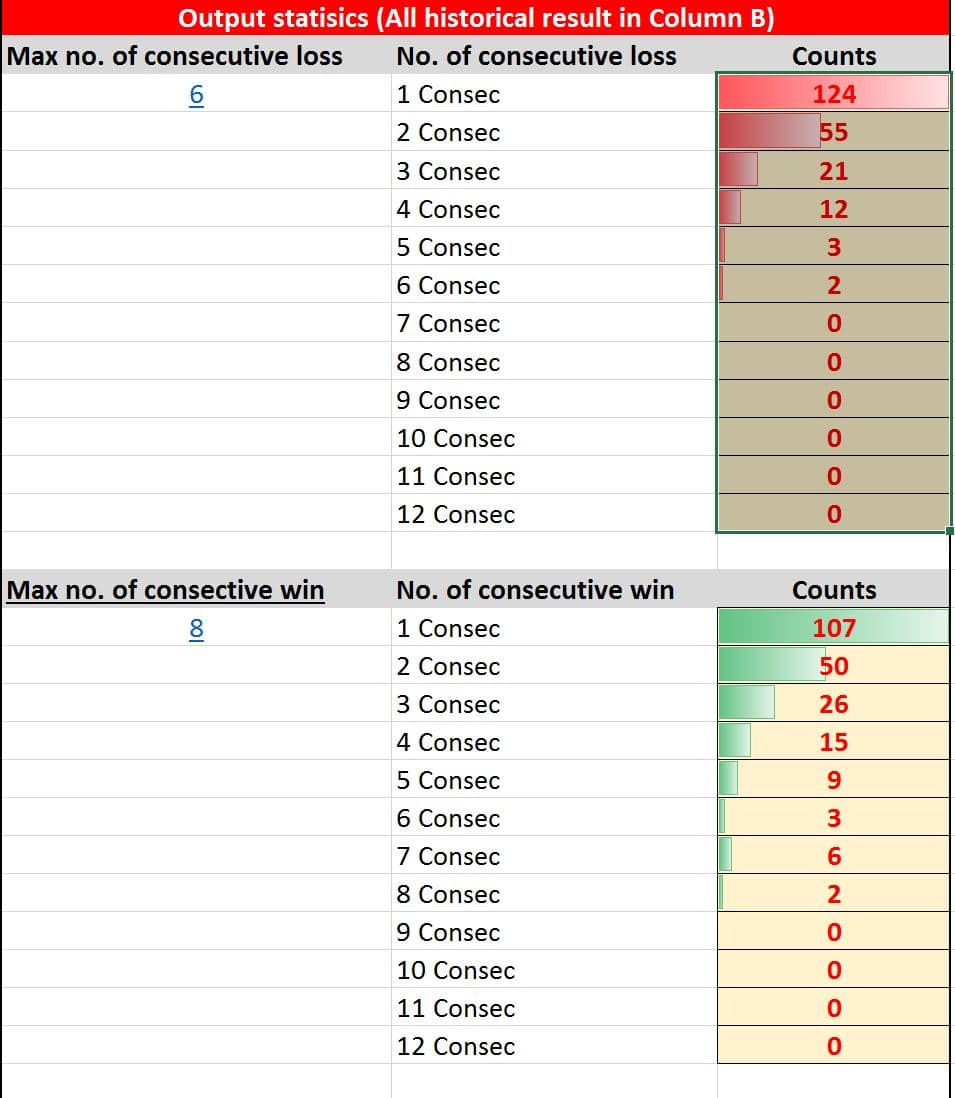
The output to be generated being as below:
example of output in the picture attached please.
Is that doable with a snippet?
Thanks a million time for whomever can do it!
Best,
Lucca
 cons.JPG
Think different
Gui
6 years ago #143255
Greetings,Would anybody be kind enough to code a snippet to be able to see through histogram or table the dispersion of win/loss count please?
The info would be available in the analysis section of the str loaded into QA.
The output to be generated being as below:
example of output in the picture attached please.
Is that doable with a snippet?
Thanks a million time for whomever can do it!
Best,
Lucca
Then the second stage would be to develop a Whatif function to exclude/change position sizing of the trades based on consecutive loss/wins, at end of sequence.
Thanks again.
Think different

mabi
6 years ago #143256
This feature would be great !
clonex / Ivan Hudec
6 years ago #143257

hankeys
6 years ago #143258
this feature will shift our trading to an another level…histogram of consec losses from whole backtest, thats what i am looking for
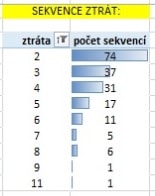 sekvence.jpg
You want to be a profitable algotrader? We started using StrateQuant software in early 2014. For now we have a very big knowhow for building EAs for every possible types of markets. We share this knowhow, apps, tools and also all final strategies with real traders. If you want to join us, fill in the FORM.
Gui
6 years ago #143260
Ill doit byt need som time
Odoslané z G3121 pomocou Tapatalku
Thank you, I’ll throw the ball back whenever I have opportunity mate,
Think different
Karish
6 years ago #143278
Wish that would be a feature in SQ4 also 🙂
tomas262
6 years ago #143439
Hello,
I have added a request for this for developers to add wins/losses streak (frequency) analysis
Gui
6 years ago #143535
Gui
6 years ago #143704
Hello clonex, just wondering how your work was developing, and if you had an idea when the feature you kindly proposed to develop would be ready?
‘‹Thanks again a million times!
Think different
hankeys
6 years ago #144673
we have talked here many times about the analysis of consecutive losses and have a plan to do a histogram to Quant Analyzer which can show us very quickly hows the consecutive losses behave at each strategy
i have been waiting too long so i purchased this for me – if anyone here interested in such a thing, send a PM or email [email protected], we can discuss
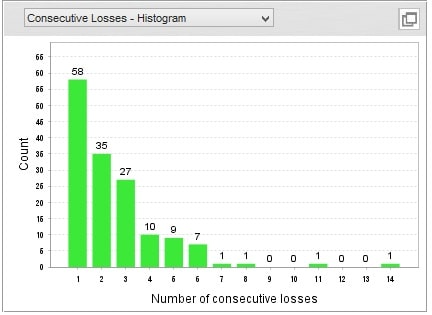 histogram of consec losses.jpg
For this particular strategy, I see that it had 14 consecutive losses (it was the extreme – BE is counted as a loss) … the losses are most changing in sequence 3 and 4, so the optimal is to wait for 5 or 6 consecutive losses, then you can statistically expect a profit period … and that’s it
i have also some new columns where i can see everything what i want to see in one view – very qucikly, i could sort by every column, etc.
You want to be a profitable algotrader? We started using StrateQuant software in early 2014. For now we have a very big knowhow for building EAs for every possible types of markets. We share this knowhow, apps, tools and also all final strategies with real traders. If you want to join us, fill in the FORM.
Viewing 10 replies - 1 through 10 (of 10 total)