


 英語
英語 スペイン語
スペイン語 ポルトガル語
 フランス語
フランス語 イタリア語
イタリア語 ドイツ語
ドイツ語カスタムインジケーターを使用するかどうかに関わらず、ラインがクロスしたときにシグナルをプログラミングする方法…
7件の返信

こんにちは、,
I’ve imported the indicator in attachment and I want to program a basic EA with the signals/condition when blue and the red line are crossing (buy or sell).
The problem is that I’ve used the “Manage Custom Indicator” Tab and I haven’t saw the lines in the output value…
When I add a rule in the strategy tab, I see the line but they aren’t in the output. How I can make a signal out of that?
My question could be also with a regular stochastic… How do we program it so we can make a signal when the 2 line are crossing in the overbought level?
Thank you a thousand time for answering my questions. I’m sure that will be read by a lot of people.
よろしくお願いいたします。,
JC
0

Hello JC Savard,
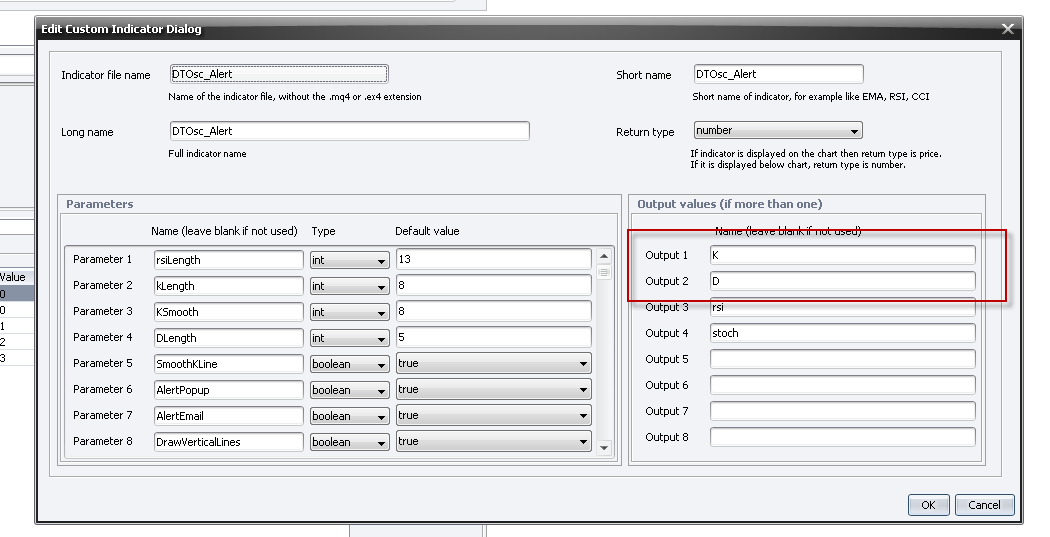
If you import the indicator there are 4 outputs available.
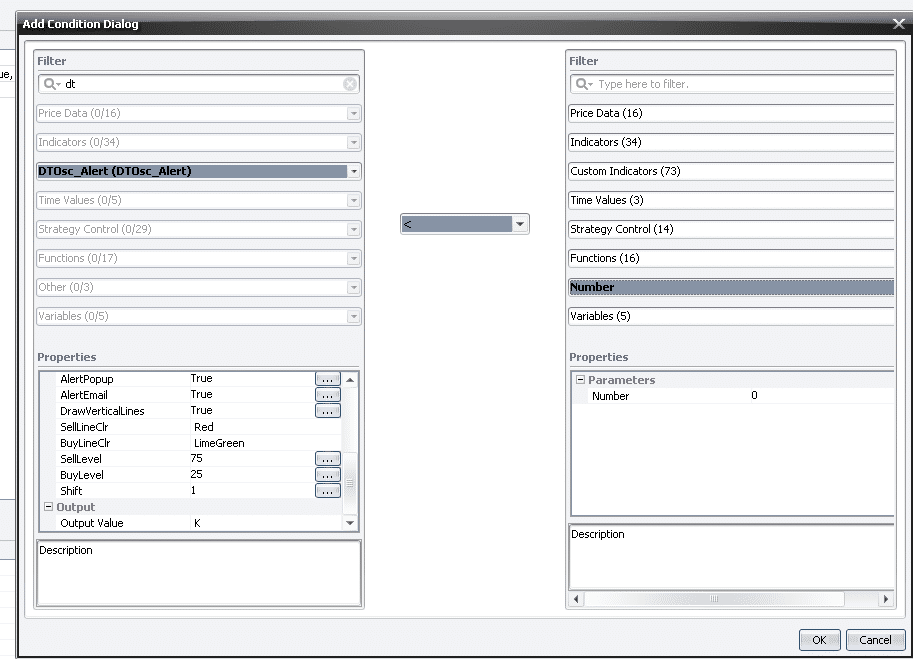
I you want to use the crossover signal you have to selsect the K (output 1[the blue line]) and the D (output 2 [the violet line]).
 24.07.png
 24.071.png
When it should only trade if the K or D line is below 20 you have to use this
 24.072.png
Hope I could help you
Cezar
0
Thank you very much Pago. It is much appreciated the images and explanations.
You have gaven me the answer but I won’t be able to reproduce this knowlegde with another custom indicator…
The question : How did you knew it was ” K and the D ” that was the output lines?
and why Blue and violet, why not Violet and Blue? Just by the order they appear?
So I can understand it myself the next time with another custom indicator I will study?
Jean-Charles
From Montreal (Quebec) Canada
0

Thank you very much Pago. It is much appreciated the images and explanations. You have gaven me the answer but I won’t be able to reproduce this knowlegde with another custom indicator… The question : How did you knew it was ” K and the D ” that was the output lines?and why Blue and violet, why not Violet and Blue? Just by the order they appear? So I can understand it myself the next time with another custom indicator I will study? Jean-CharlesFrom Montreal (Quebec) Canada
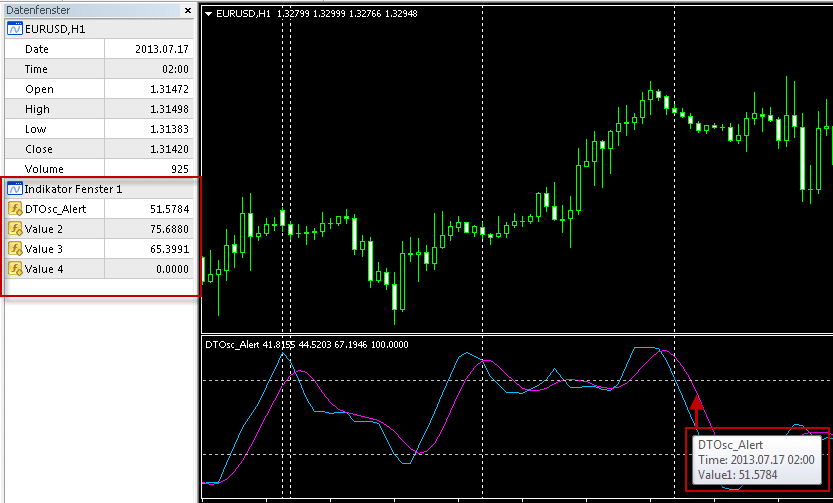
Until Pago answers, what I do is ……with indicator on the chart I move cursor over whatever line and a tiny box opens that tells you whether its value1 or say value3 or whatever valueX. Then you know which ones in custom indicator setup window you are interested in that same order. Hope that helps,
ジェリー
0
You can do it like batch それ has written. You can also see the values in the data window. In the next step I create a simple long and short condition へ verify this values in a backtest.
Then you can see if the EA will open trades at the crossover. If not I use the trial そして error system with the other values 😉
 31.07.png
Cezar
Thank you very much Pago. It is much appreciated the images and explanations.
You have gaven me the answer but I won’t be able to reproduce this knowlegde with another custom indicator…
The question : How did you knew it was ” K and the D ” that was the output lines?
and why Blue and violet, why not Violet and Blue? Just by the order they appear?
So I can understand it myself the next time with another custom indicator I will study?
Jean-Charles
From Montreal (Quebec) Canada
0

こんにちは、,
it is as Cezar said – you can find out which output value belongs to which line by looking at the lines in the chart and the indicator values in Data window.
When indicator has more output values than lines it is little bit tricky, you have to look at the values carefully – for example
look where blue line is above red one, also the output value belonging to blue should be bigger than output value belonging to red line.
マーク
マーク
StrategyQuantアーキテクト
0
7件の返信を表示中 - 1 - 7件目 (全7件中)