Building a profitable EURUSD strategy
by Mark Fric
In this article I’ll explain the complete step-by-step process of building a profitable, robust strategy for EURUSD, including multiple steps of different robustness tests.
There is also another variation of this article about Strategy Building Process for E-Mini S & P 500 Futures.
When using machine learning techniques such as genetic programming the most important part of strategy building process is testing strategy for robustness to ensure that it is not curve-fitted to historical data.
I use double OOS filter plus Robustness Tests plus Walk-Forward Matrix test.
Inputs
The only inputs I use are my expectations of the strategy – I want to build a strategy for EURUSD that is profitable and has as little drawdowns as possible. I want the strategy to be robust enough so that it works also on other symbols (GBPUSD) and I want it to pass Walk-Forward Matrix test to make sure that reoptimization works on this strategy.
Strategy building process
- Generating a big pool of potential candidates
- First filter – Out of sample (OOS) check
- Second filter – retesting and second OOS check
- Third filter – GBPUSD check
- Fourth filter – Robustness tests
- Fifth filter – Walk-Forward matrix test
Generating a big pool of potential candidates
In the first step I simply have to generate large pool of potentially “good” strategies that I’ll test for robustness later. I want my all initial strategies to be profitable and robust (to some extent), so I employ several filters also in this first phase.
My settings for this step
You can download the settings I use in this step using the link below. Click on the link with right mouse button and choose Save link as…
Then in StrategyQuant use Load settings to load this settings file to the program.
build_eurusd_strategy.xml
Settings explained
First of all, I generate all my strategies on multiple symbols. My goal is to find a good strategy for EURUSD, but I want my strategy to be robust – so I want it to be profitable also on GBPUSD. I add GBPUSD to the additional data, so now the strategy will be tested on both symbols.
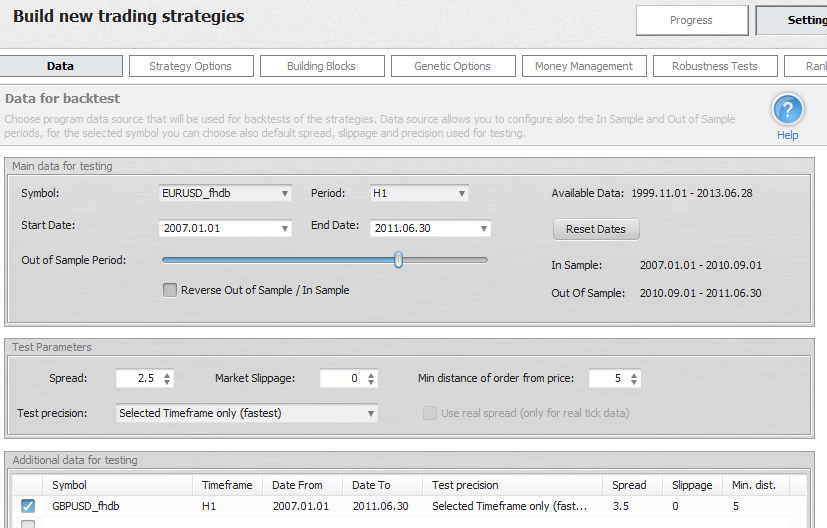 Image 1: Setting the data
I’ll use data from 1.1.2007 to 30.6.2011, which is 4 and half years. The rest of the data will be left for further OOS testing later.
I’ll use Genetic Evolution mode. The idea is to make a population of 200 strategies, evolve them during 30 generations and then start again from scratch. This way I’ll avoid running into a dead end during evolution and the best strategies are continually stored to Databank.
You can also see that the only condition for initial population is that it must make at least 100 trades. It doesn’t need to be profitable – genetic evolution should be able to improve it.
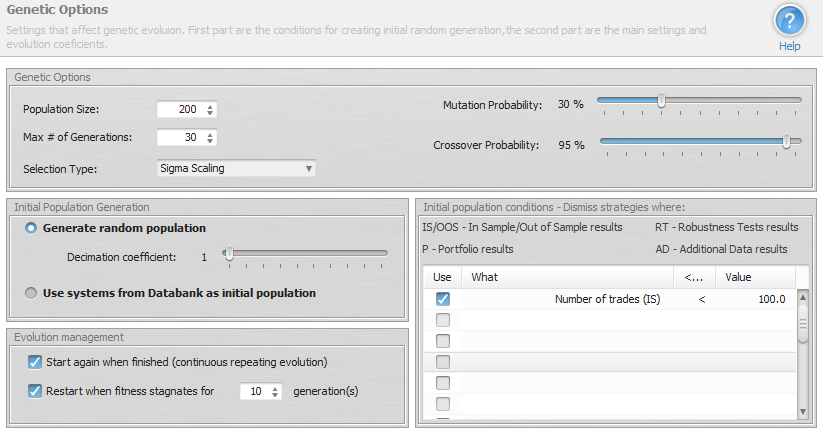 Image 2: Genetic options
The last important piece of setting is Ranking options. I set Databank to store 2000 best strategies, because I want to have a good base for further selection process. I also set the selection criteria to Return / Drawdown ratio – this is my favorite. You can use other selection criteria, perhaps you’ll get better results.
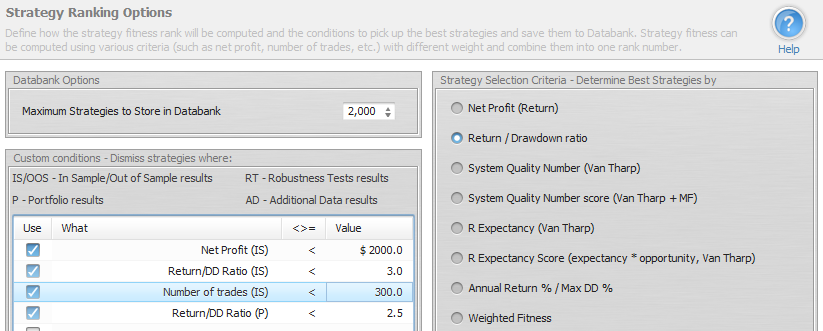 Image 3: Ranking options
Othe of the most important things is to set the initial filter criteria for strategies in Databank. I want to consider only strategies that are at least $2000 in profit, have Return/DD ratio > 3, at least 300 trades AND Return / DD ratio of a portfolio to be at least 2.5.
Because I’m testing the strategies on two symbols – EURUSD and GBPUSD, the portfolio results for the strategies will be also computed. Using this condition I simply specify that the portfolio performance won’t be much worse than performance on only EURUSD, and the program will dismiss all strategies with bad portfolio performance.
Now we just have to hit the Start button and let the program do the work.
Remember, we want to generate at least 2000 “good” strategies before we’ll continue with the filter process.
Depending on the settings and speed of your computer it could take several hours or even days, so be patient. If the program doesn’t produce any strategy for a very long time, perhaps we should switch to a higher timeframe – H4 or D1, or decrease the constraints.
1. First filter – Out of sample (OOS) check
When I have 2000 potentially good strategies in the Databank, I’ll stop the generation and start filtering process.
I’ll apply the first filter – by removing all the system that have bad Out of Sample performance. I can do it quickly, just by sorting the strategies in Databank and deleting the ones that have OOS profit smaller than $500.
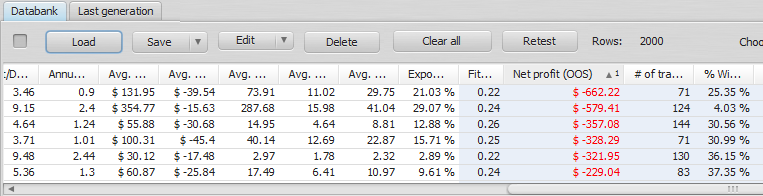 Image 4 Databank with pool of strategies sorted by OOS Net Profit
This first step usually removes a big portion of strategies, so from initial 2000 candidates we are down to around 1500.
2. Second filter – retesting and second OOS check
In this step I’ll retest all the strategies using the 1 Minute precision on the unknown Out of Sample period.
I used Selected timeframe precision in the Build stage to make the tests as fast as possible, but before further evaluation I want to ensure that backtests are really reliable, so I retest all the strategies with higher precision.
Retesting the strategies is simple – I’ll just select all the strategies in the Databank and click on Retest button. This will move all the strategies to a Retest tab. I’ll also confirm dialogue asking if it should use the build settings for Retest
I’ll then extend the data period to the end of available data. Strategies were generated on data from 1.1.2007 to 30.6. 2011, I’ll now retest the strategies on data until 30.6.2013 and set Out of Sample period from 2.7.2011 to 28.6.2013.
Note that this will retest the strategies on new unknown part of data, and the OOS part will show the strategy performance during the last year and half.
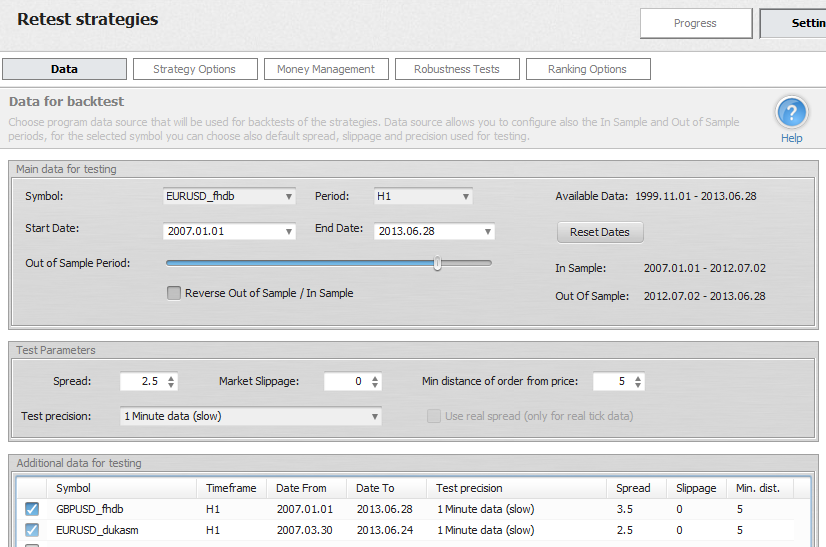 Image 5: Setting test precision to 1 minute
Because I have also another source of EURUSD historical data (free data downloaded from Dukascopy) I’ll add them to additional data to compare the performance on both EURUSD data sources.
The test could take some time and after it is done I’ll once again remove all the system that have bad Out of Sample performance. Again I can sort the strategies in Databank by Net Profit (OOS) and delete the ones that have OOS profit smaller than $500.
3. Third filter – GBPUSD check
In this step I’ll check performance of the strategies on GBPUSD symbol. I’ll go to Results -> Equity chart, switch chart to GBPUSD/H1 or to Portfolio and go through strategies one by one looking at the chart for GBPUSD.
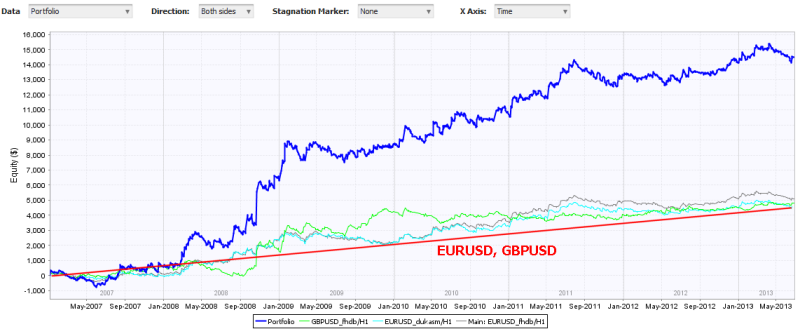
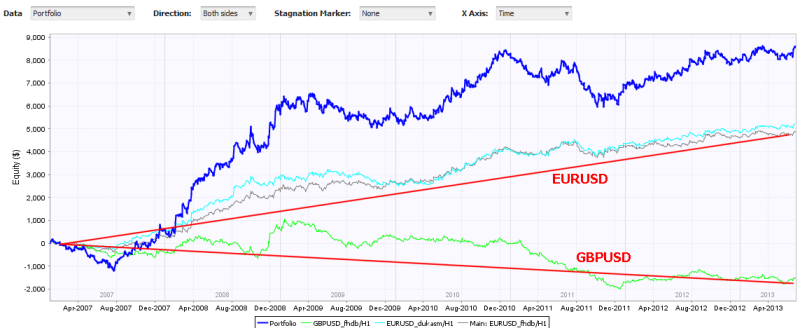 Image 6: Example of good and bad GBPUSD performance
I’ll consider only strategies that show at least some profitability on GBPUSD. The equity curve doesn’t need to be perfect, but it should be growing without extreme drawdowns.
This filter is very though – we’ll usually find only a few strategies that pass this test.
So from initial 2000 we are usually down to 5-15 strategies.
4. Fourth filter – Robustness tests
After removing all the strategies with bad GBPUSD performance there are less than 10 strategies left that have good IS and OOS performance, as well as satisfactory performance on GBPUSD. I’ll now retest strategies again with Robustness tests and Money Management to see how each of the strategies handles small changes in inputs and to be able to compare the strategies to each other.
I’ll change money management from fixed size to fixed amount, letting every startegy risk $100 per trade. This allows for better strategies comparison, because they risk the same amount per trade.
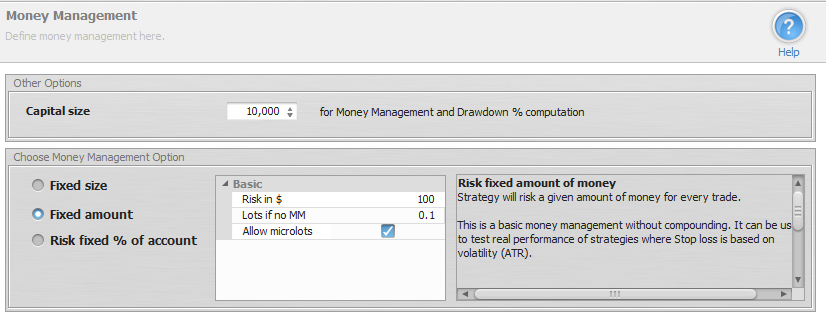 Image 7: Setting money management to fixed amount
In Robustness tests I use at least 20 simulations and test the strategy for all types of stress situations. After configuring the robustness test I retest the strategies again.
This time it will be fast because there are only few strategies left in the Databank.
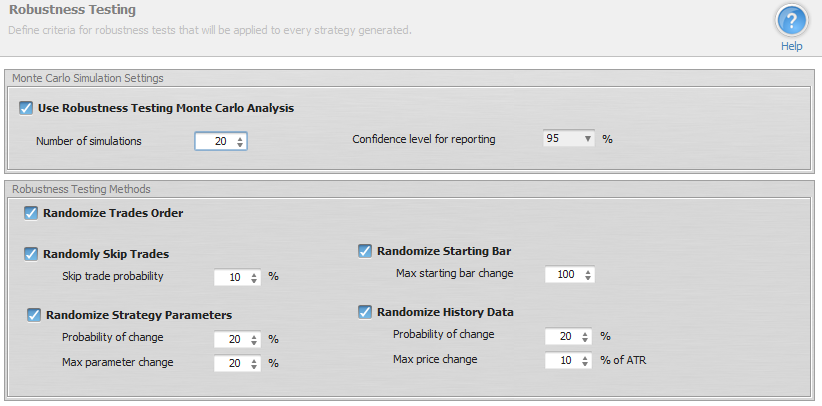 Image 8: Robustness tests
How to evaluate Robustness tests
Robustness tests show us how the strategy can behave in reality, when there are missed trades, different history data etc. I’m looking for strategies that have acceptable values for Net Profit and Drawdown in 95% confidence level.
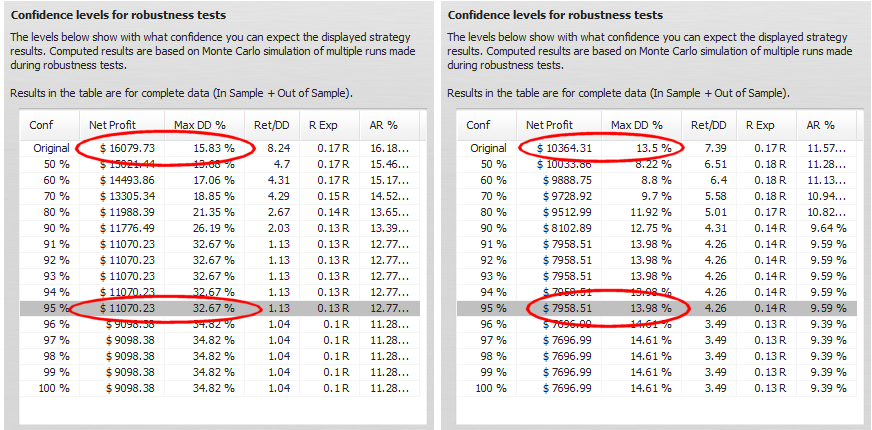 Image 9: Robustness tests results
In the example above we can see robustness results for two strategies. Strategy on the left has profit in acceptable level, but drawdown more than doubled compared to original result.
Strategy on the right has also profit in acceptable level and drawdown was almost unchanged.
In this step I’ll choose only 1-3 final strategies that will be subjected to next test of robustness.
These final strategies are selected by the best results in robustness tests, overall profitability an dalso simplicity – I want the strategy rules to be as simple as possible, and trading rules should make some sense.
5. Fifth filter – Walk-Forward Matrix test
We are left with a few strategies and we can run the ultimate test for robustness – Walk-Forward Matrix test. WF Matrix is simply a matrix of walk-forward optimizations with different number of runs and run periods.
If the strategy passes Walk-Forward Matrix test it means that with the help of parameter reoptimization the strategy is adaptable to a big range of market conditions AND also that the strategy is not curve fitted to particular data – since with reoptimization it works on many different time periods.
In addition to this WF Matrix test also tells us if the strategy should be permanently reoptimized and what the most optimal reoptimization period is.
Walk-Forward Matrix test has to be done for every strategy separately. I’ll load my strategy to Optimizer and select Walk-Forward Matrix option. I’ll also select steps for runs and OOS percentages. StrategyQuant will go through all these combinations, performing Walk-Forward optimization of the strategy.
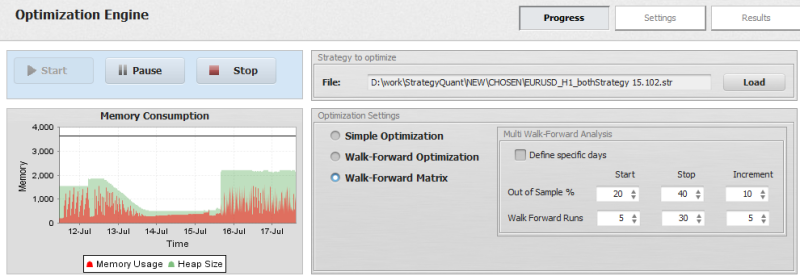 Image 10: Setting up Walk-Forward Matrix
Setting parameters for optimization
For optimization to make sense you have to set the strategy parameters that will be optimized. Each strategy uses different logic and has different parameters, so you have to configure the optimization differently.
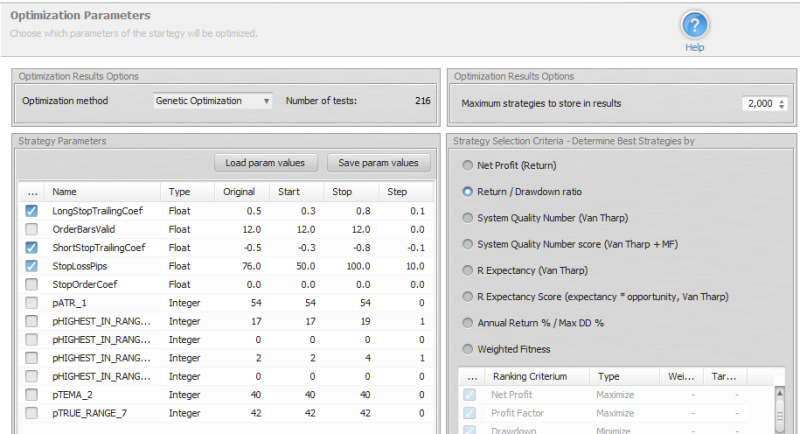 Image 11: Optimizing parameters
This strategy is relatively simple, so I’ll optimize only Stop Loss value and stop trailing coefficient.
It is not necessary to optimize all parameters, only these that have the biggest impact on strategy performance.
Now I can start the WF Matrix optimization. This could be a long process that could take several hours – depending on settings and number of steps and parameters optimized and the speed of your computer.
Evaluating Walk-Forward Matrix
When optimization finished, I’ll click on the Walk-Forward matrix result in Databank to see the details.
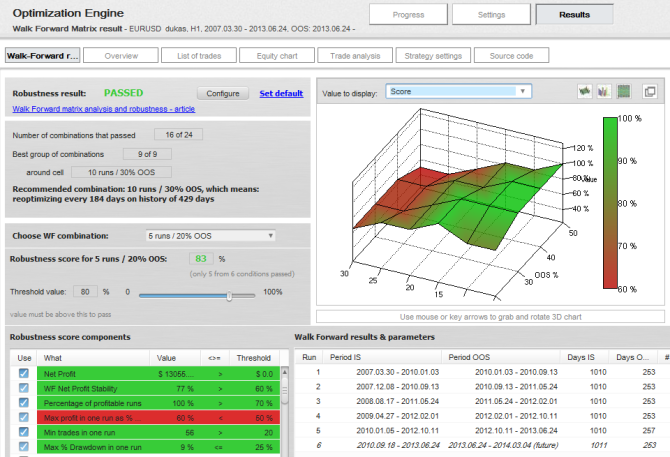 Image 13: Walk-Forward Matrix results
The final result is that the startegy passed Walk Forward matrix test for robustness. The 3D score chart shows us that 16 out of 24 combinations passed our criteria (default settings used).
The strategy doesn’t need to pass for every combination, I’m looking for 2×2 or 3×3 area that has most of the combinations passed – this will be the group of best reoptimization combinations. In this case, I can see that 10 runs with 30% Out of Sample is one of the best combinations, because it is surrounded by other combinations that also passed.
When I check the Walk-Forward optimization chart I can see that the strategy remains profitable also during reoptimization.
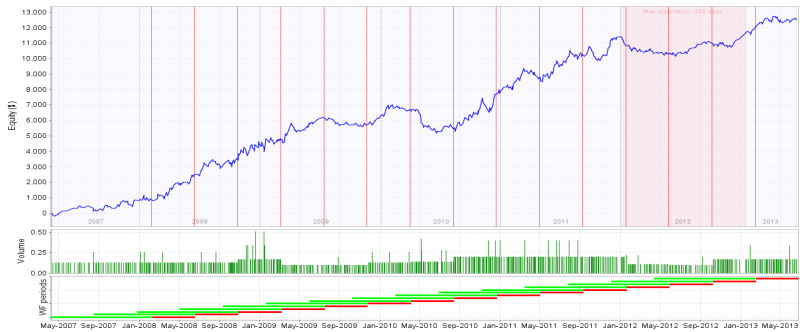 Image 14: Walk-Forward optimization chart
Walk Forward Matrix gives me also another important information – how often should we reoptimize the strategy?
For our selected combination of 15 runs with 30% Out of Sample:

Summary
I described my complete process of working with StrategyQuant, which led to few interesting new strategies.
You can try it yourself, take inspiration and possibly improve the process with your own ideas which you can share on our forum.
Possible improvements of the process – you can try to look for strategies separately for long and short direction. Every direction has its own dynamics, and different strategies for long and short could return better results.
I didn’t mention Improver – it is a powerful tool that allows you to look for better variation of your existing strategy, if you are still not satisfied with the performance.
Just keep in mind – the point is not to find strategy that is perfect on historical data. This is a recipe for disaster, because overly optimized strategy is guaranteed to fail in real trading.
Our goal should be to find a strategy that is robust across different data and/or symbols, because this means it has real edge over the market.

 Tomas Vanek

How could be the settings on SQ4? I see it has new features and it will be great to upload the settings for a good generation of strategies.
Thank you very much!!!