</> Codebase
StrategyQuant X platform codebase – a place to share coded customizations and extensions – among all users.
Result Plugins
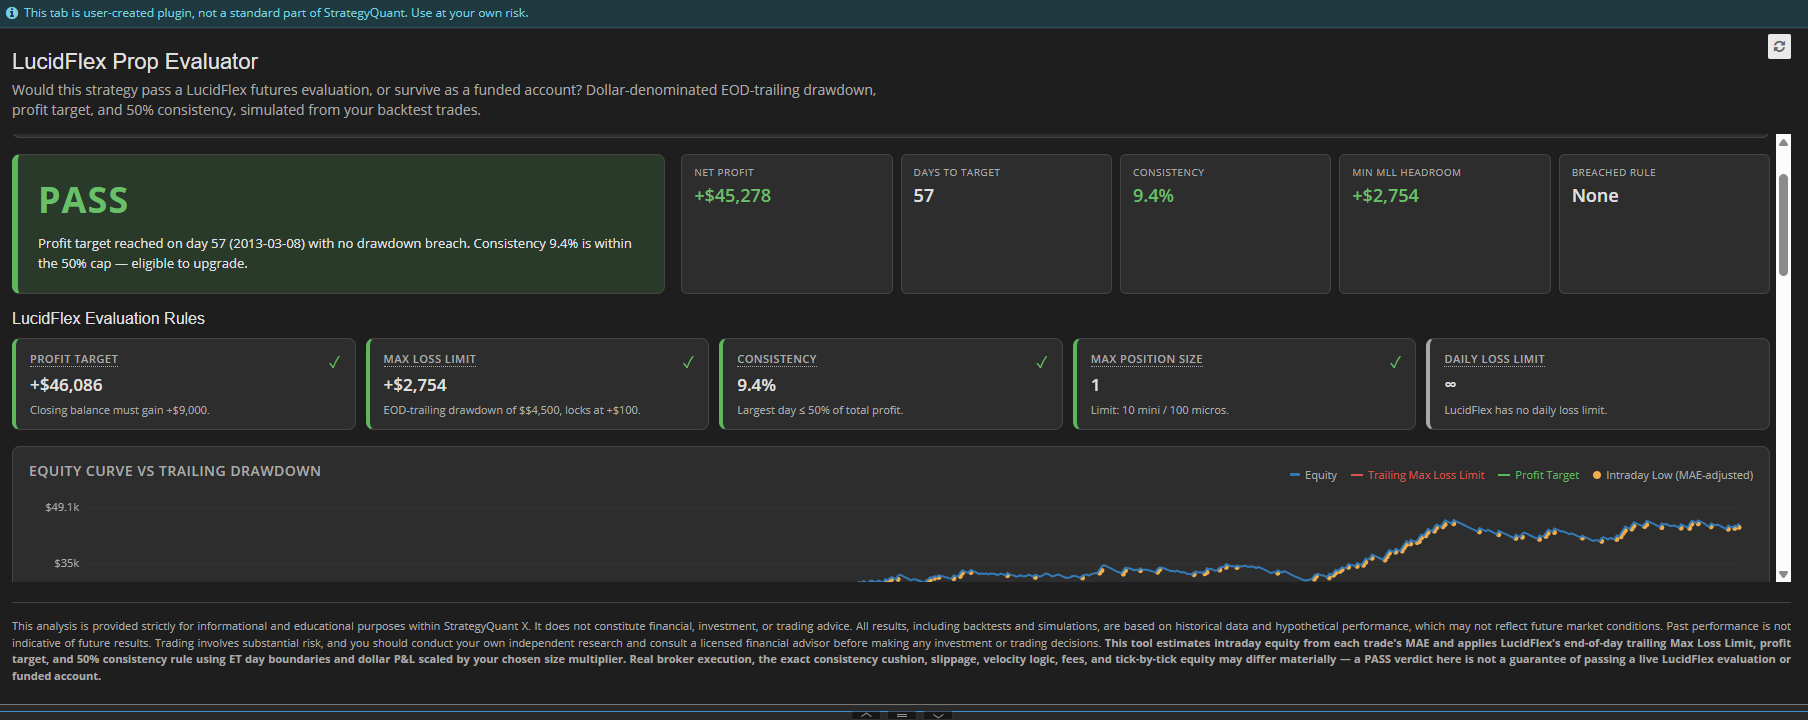
LucidFlex Futures Evaluator
The LucidFlex Prop Evaluator takes the trades from your StrategyQuant X backtest and replays them th...
AlgoWizard
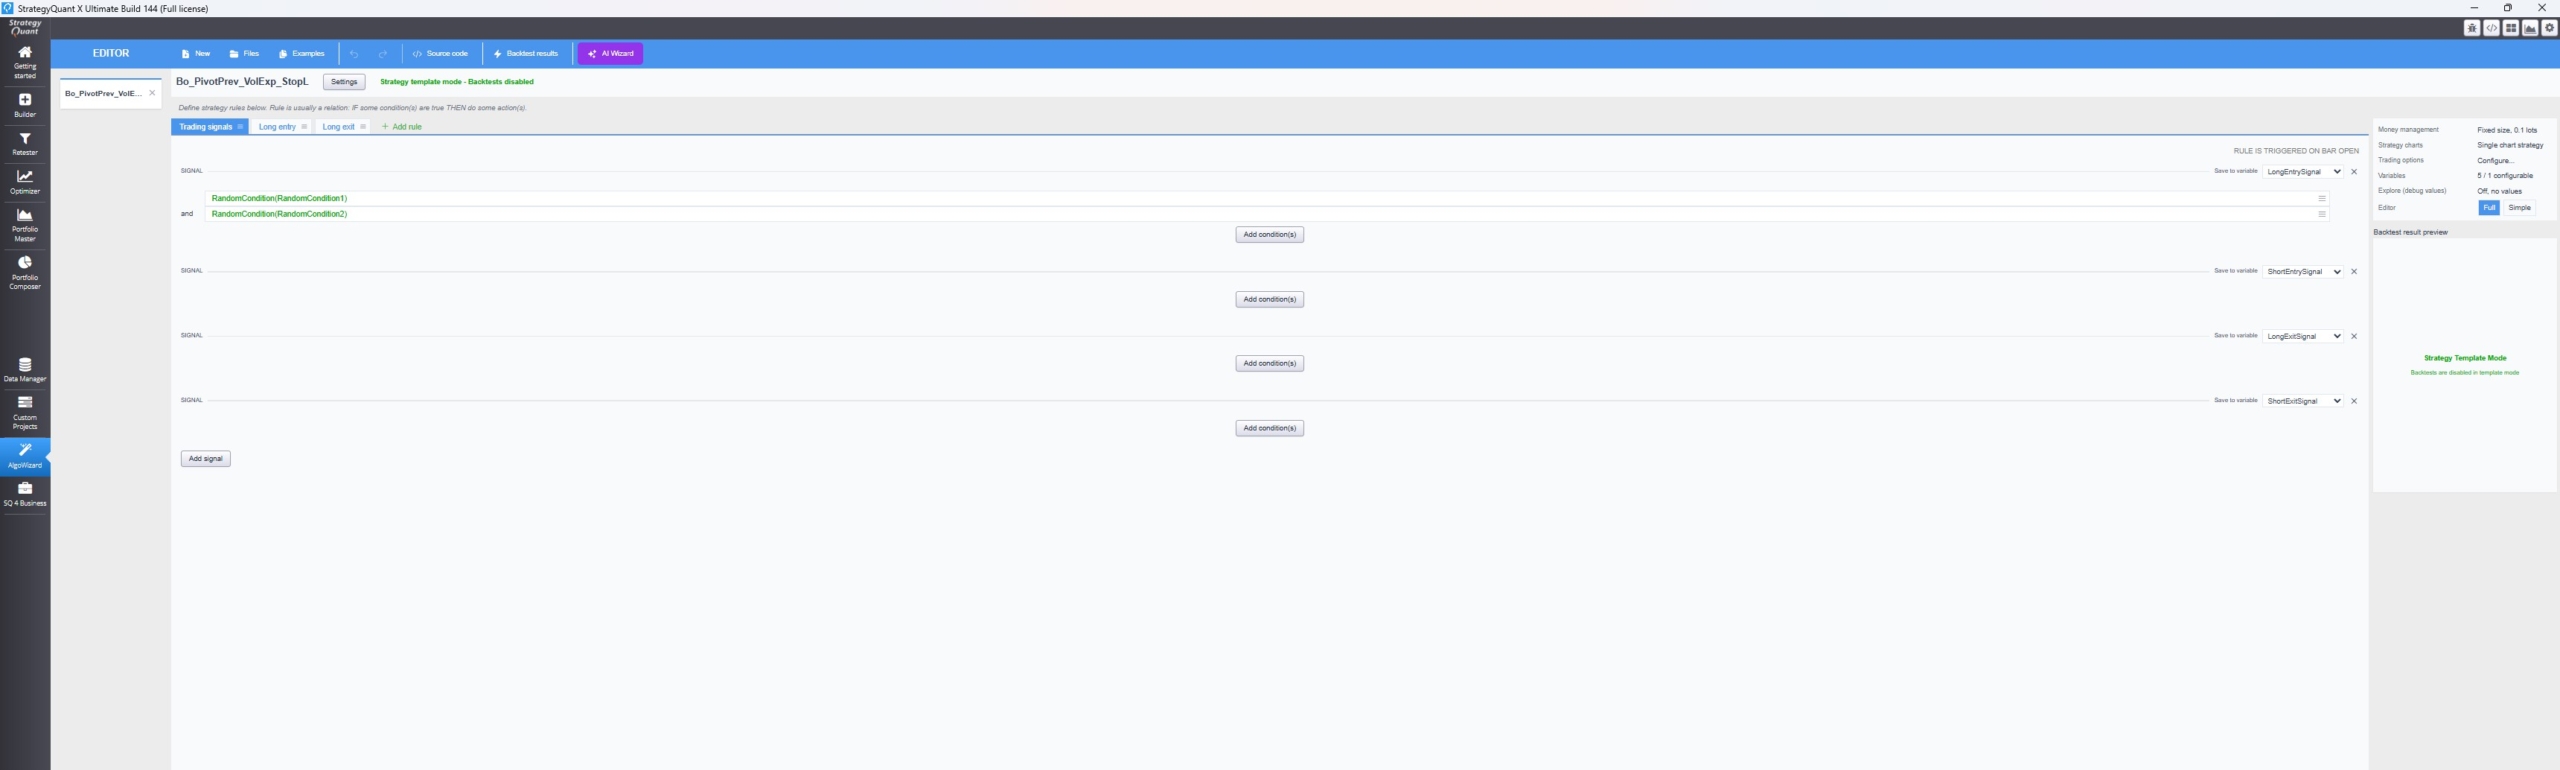
Strategy Templates Skills
Describe a strategy idea in a sentence — "breakouts only in the trend direction" or "a session-gat...
AlgoWizard
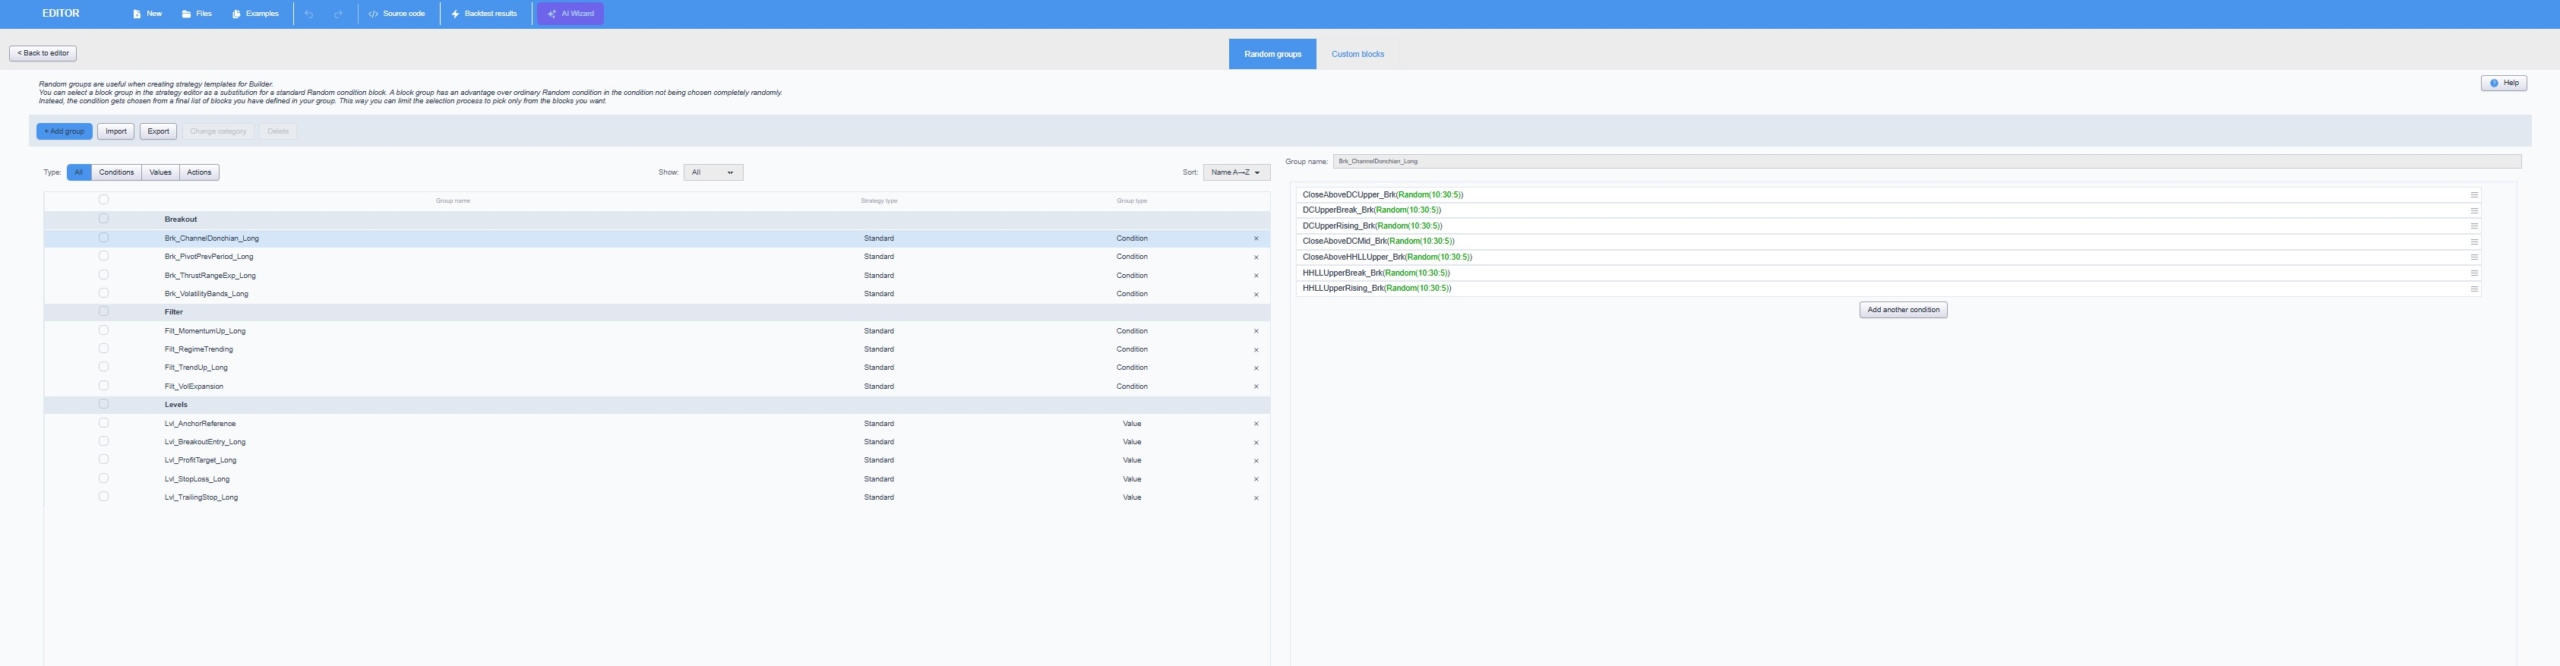
Random Groups Skills
Say what you want pooled — "a group of my breakout triggers" or "a Value group of EMA, KAMA and AT...
Result Plugins
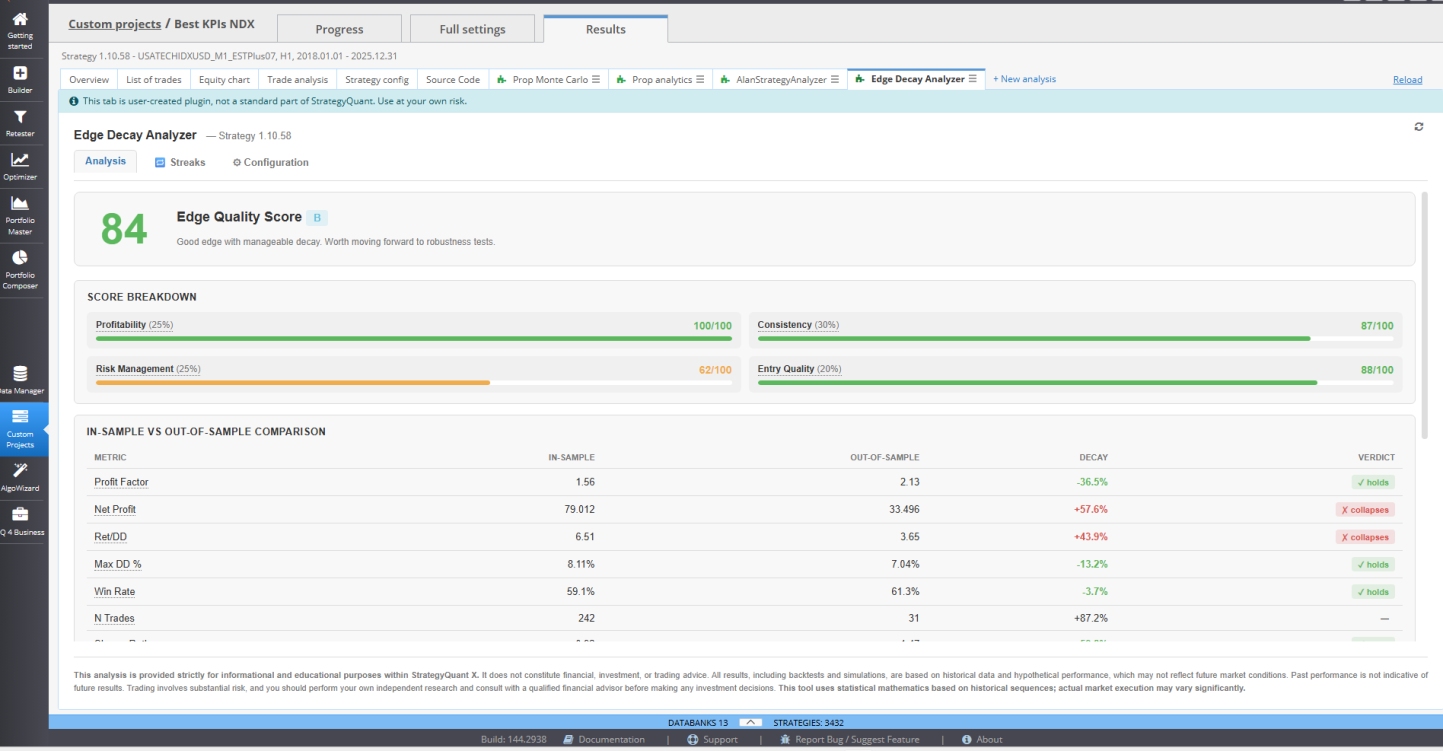
Edge Decay Analyzer
If you build algorithmic strategies in StrategyQuant X, you already know the hard part isn't generat...
AlgoWizard
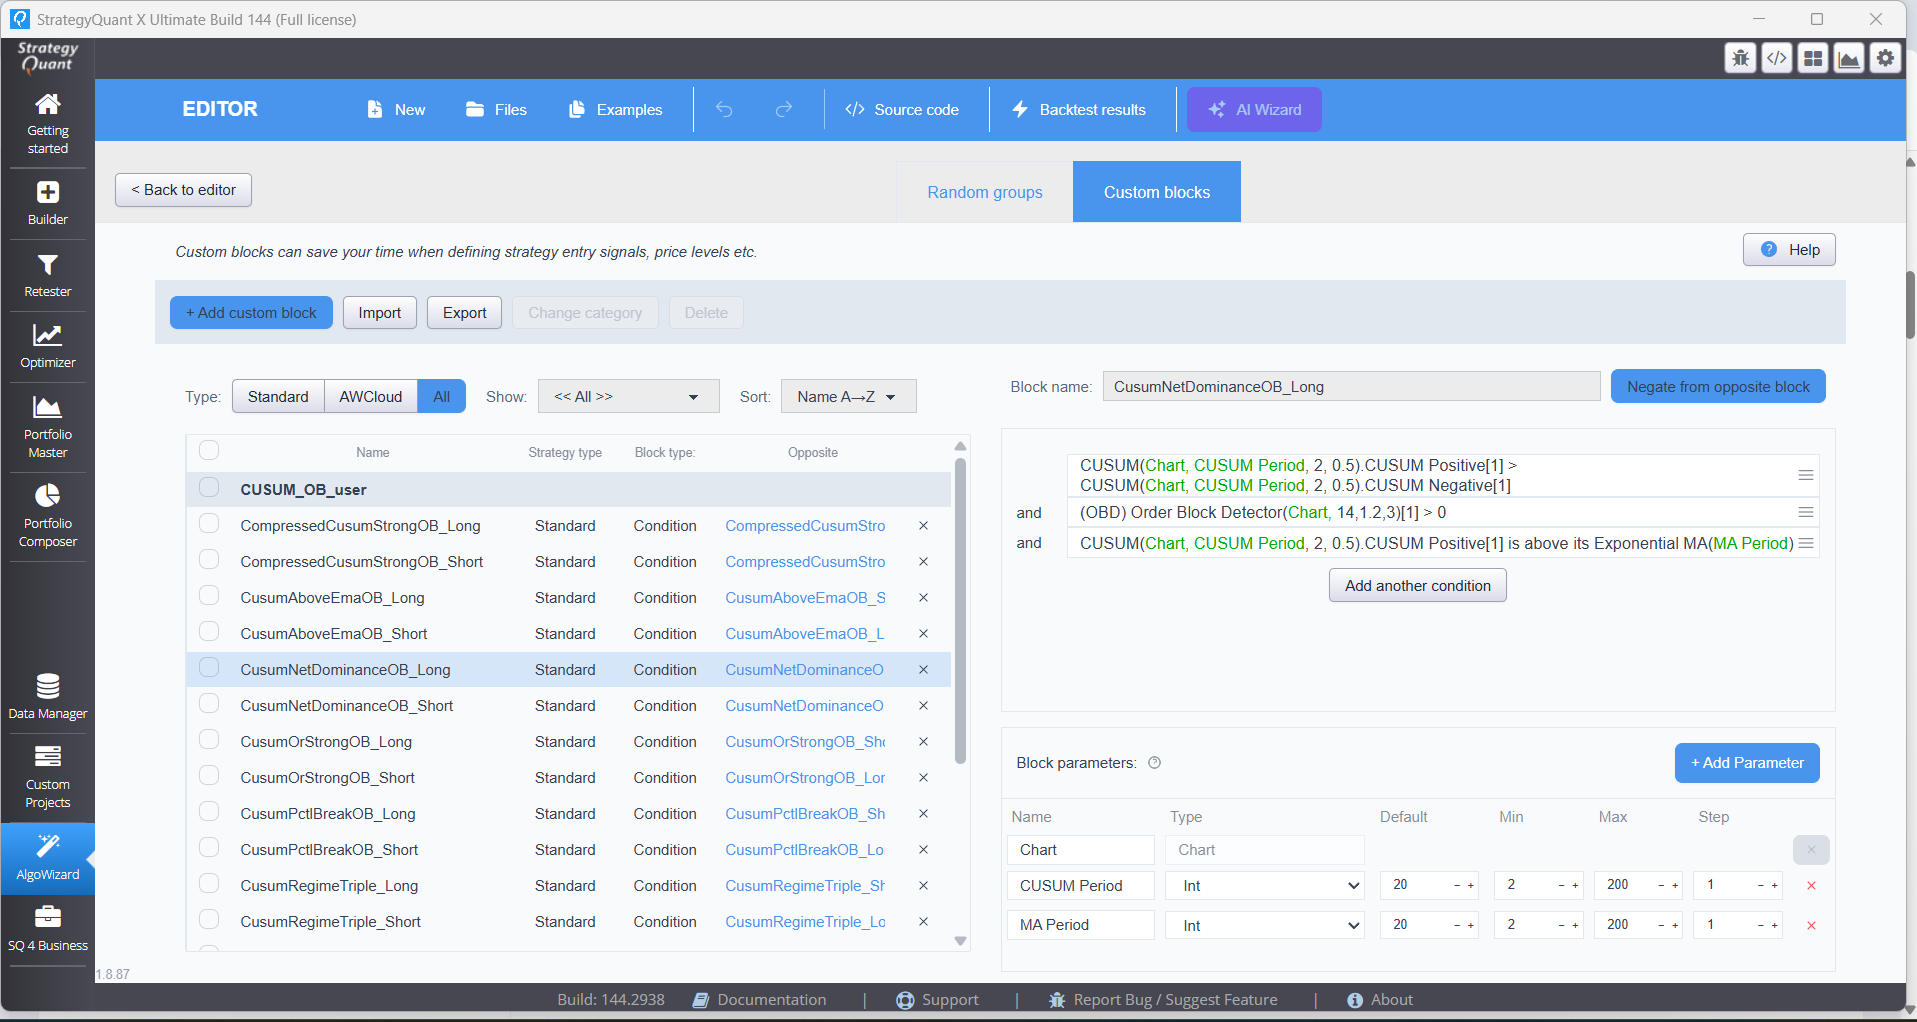
Custom Blocks Skills
Describe a rule in one sentence. Get back a validated, import-ready custom block — built from the ...
Result Plugins
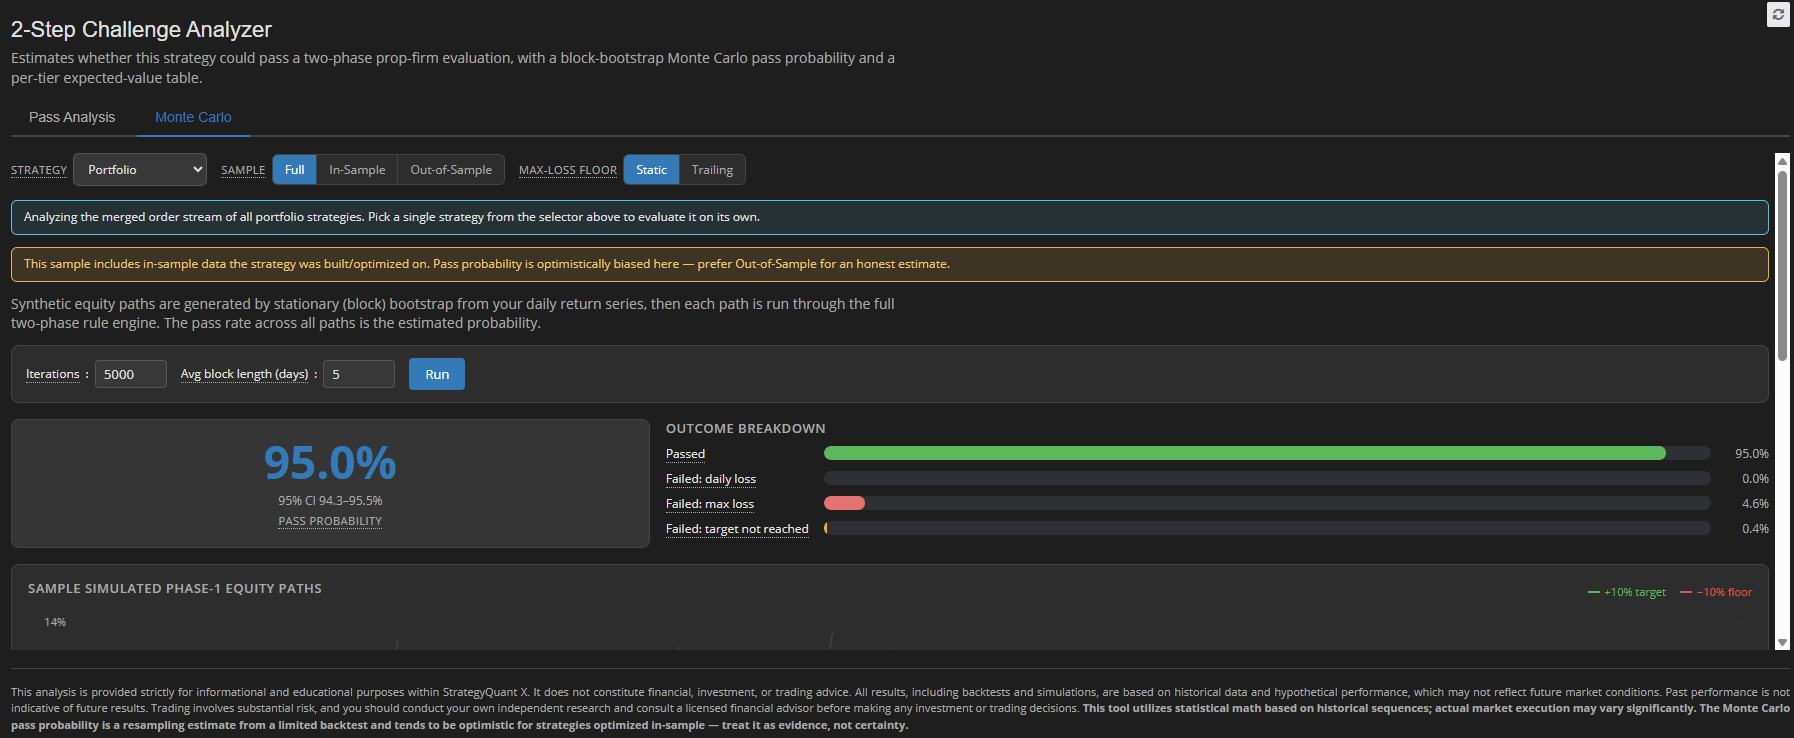
The 2-Step Challenge Analyzer for FTMO: Know If Your Strategy Will Pass Before You Pay
The 2-Step Challenge Analyzer is a free Results-tab plugin for StrategyQuantX. It takes any strategy...
Result Plugins
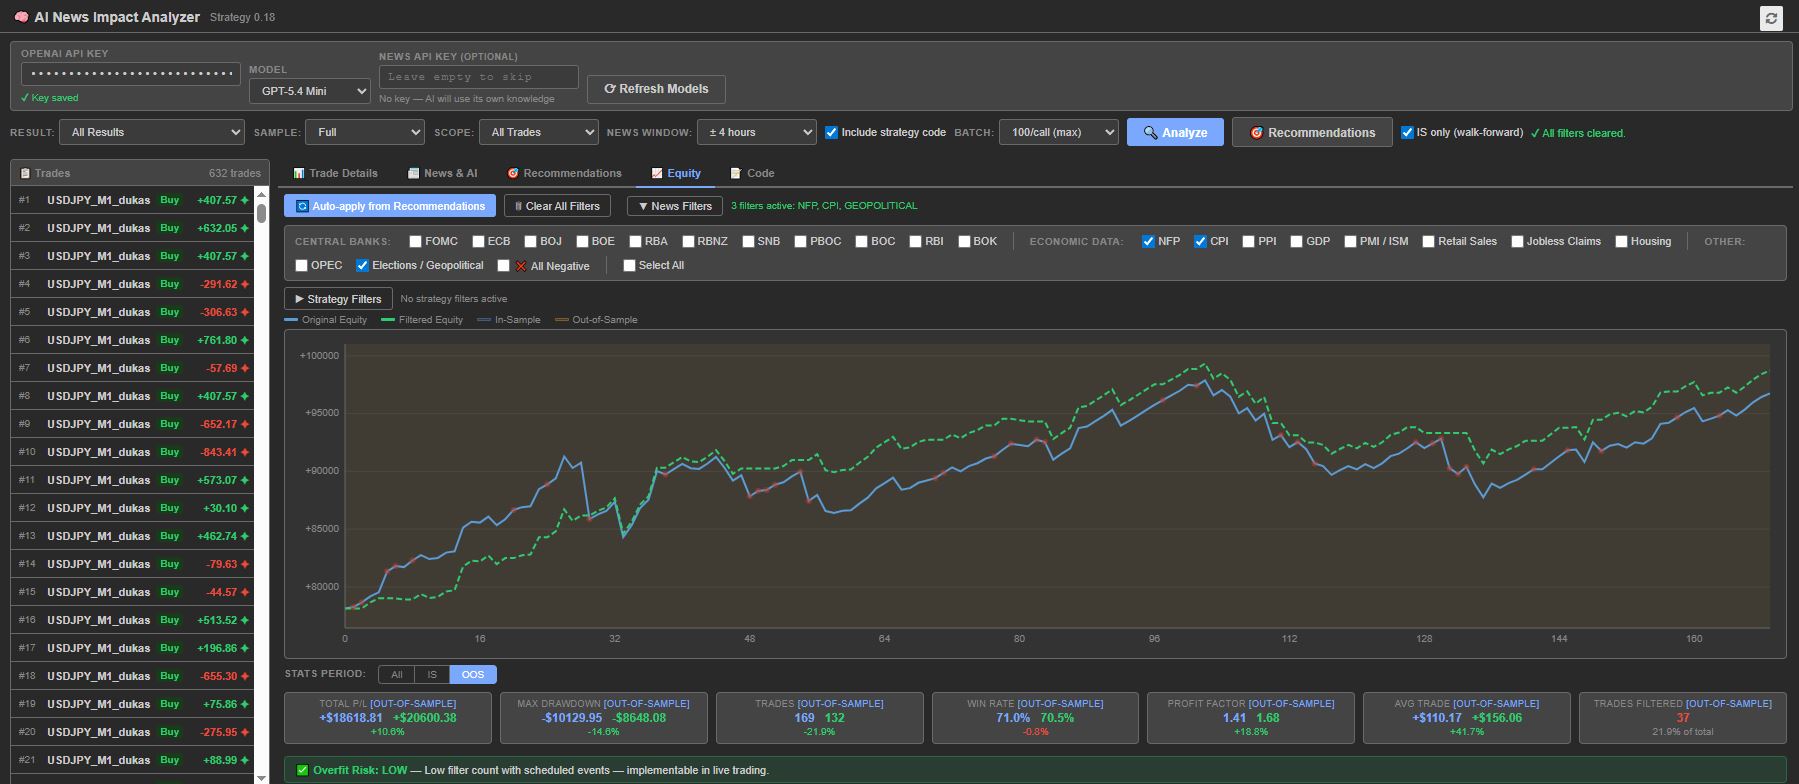
AI News Impact Analyzer
The AI News Impact Analyzer is a Results Plugin for StrategyQuant X that uses artificial intelligenc...
Result Plugins
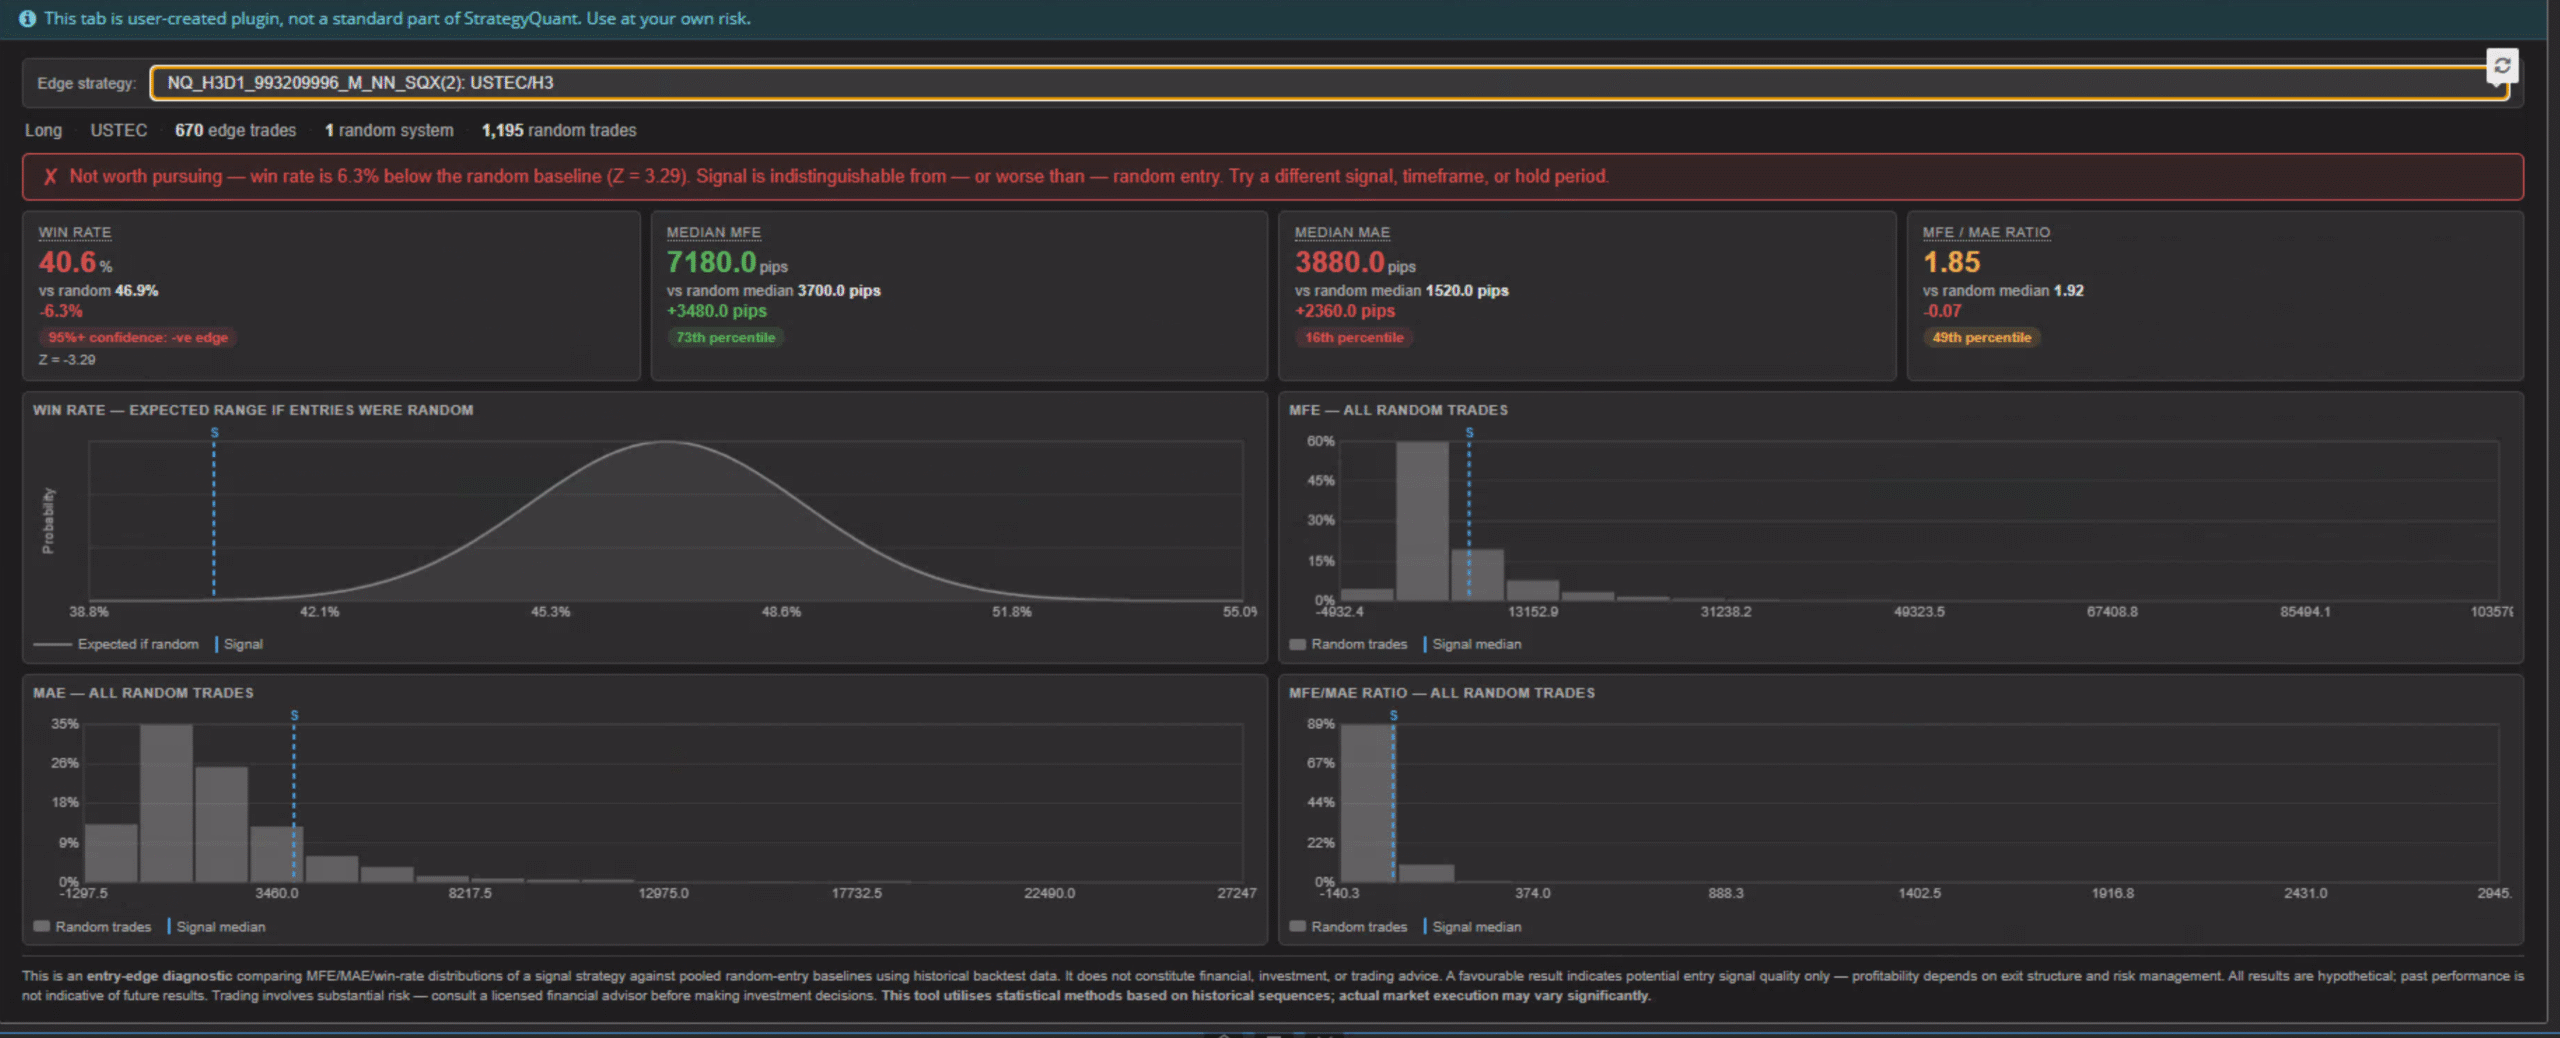
Strategy VS Random Edge Testing: WinRateEdge Results Panel
Strategy VS Random Edge Testing...
Result Plugins
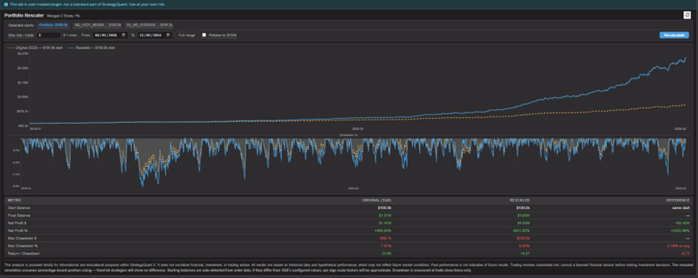
Portfolio Rescaler
A truer view of portfolio stats if scaling was done via a combined P&L...
Result Plugins
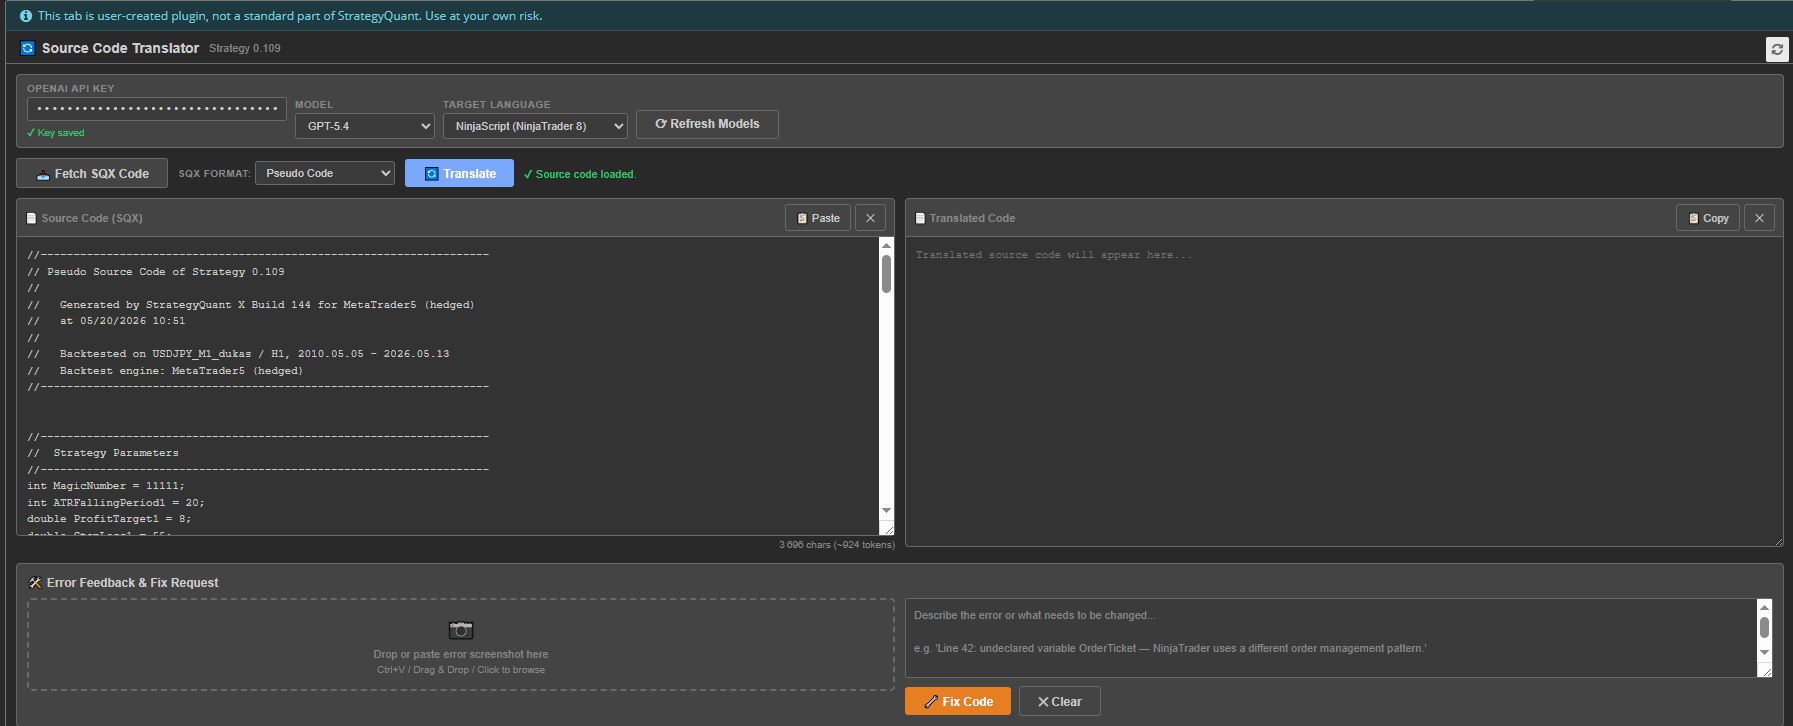
Source Code Translator
Source Code Translator — AI-powered strategy code translation directly inside StrategyQuant X...