


 英語
 スペイン語
 ポルトガル語
 フランス語
 イタリア語
 ドイツ語
ドキュメント
アプリケーション
Last updated on 17. 6. 2020 by Mark Fric
ロギングとデバッグコンソール
ページのコンテンツ
DebugConsole in StrategyQuant X is intended to allow easier debugging/logging when you develop your own snippets in SQ CodeEditor.
It is simple to use and allows you to see what’s going on “behind the scene” when your snippet is executed.
How to use it in code
There are two methods available:
debug(category, message)
logs the message to a debug console (more about this later)
そして
fdebug(category, message)
logs the message to a standard log file located in /user/log/StrategyQuant
Both methods have the same two parameters:
- category (string)– name of logging category – when you have multiple debug messages you can categorize them to be able to filetr messages by category
- message (string) – an actual text message to be logged
Note – functions debug() and fdebug() should be available in all the snippet classes in builds from 128 up. In Build 128 these methods are missing in indicator classes, so you can use alternative calls:
debug() -> DebugConsole.log()
log() -> Log.info()
Example of use
We will add a logging to a CCI indicator, to its OnBarUpdate() method, where the indicator values are computed:
@Override
protected void OnBarUpdate() throws TradingException {
    averageCalculator.onBarUpdate(Input.get(0), CurrentBar);

    if (CurrentBar == 0) {
        Value.set(0, 0);
    }
    else {
        double mean = 0;
        double sma = averageCalculator.getValue();

        for (int idx = Math.min(CurrentBar, Period - 1); idx >= 0; idx--) {
            mean += Math.abs(Input.get(idx) - sma);
        }

        if(mean < 0.0000000001) {
            Value.set(0, 0);
        } else {
            double cci = (Input.get(0) - sma) / (mean == 0 ? 1 : (0.015 * (mean / Math.min(Period, CurrentBar + 1))));
            Value.set(0, cci);

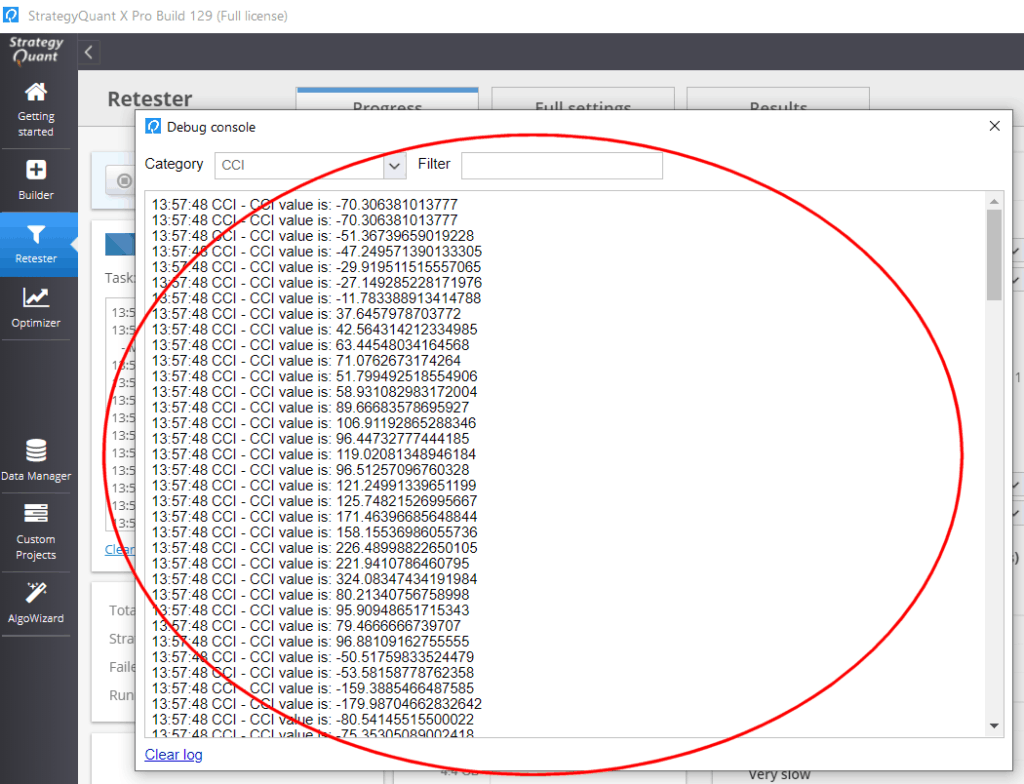
            debug("CCI", "CCI value is: "+cci);
        }
    }
}
Note that we added only a line:
debug("CCI", "CCI value is: "+cci);
We used debug() method, so the logged messages were added to a special debug console which is available on the top right under debug icon:
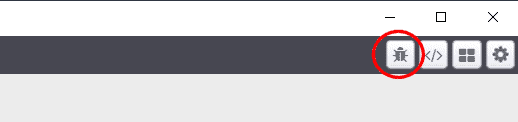
When you open it after running a test of some strategy containing CCI indicator you’ll see the messages were logged:
この記事は参考になりましたか? この記事は役に立った この記事は役に立たなかった
if I use the command fdebug, it is working I can see the output in the log, but if I use debug , nothing appear in the debug console
I can not select any category other than “all”
Does this method failed now? Because it can’t be use
debug(category, message) and fdebug(category, message) in code editor directly.
strange title : Logging and DebugColsole
こんにちは,
I’m trying to do something similar: logging spread. However my .mp5 file gives an error when compiling. Anyone know what is the problem with the code?
心より感謝申し上げます。
pseudo code (“Spread” as double variable):
//——————————————————————–
// Trading rule: Assign Variable (On Bar Open)
//——————————————————————–
もし Is Bar Open
{
// アクション #1
スプレッド = Spread In Pips(“Current”);
}
//——————————————————————–
// Trading rule: Recording (On Bar Open)
//——————————————————————–
もし Is Bar Open
{
// アクション #1
Log To File: “NQ_spread.txt”, “”current spread is, “+Spread”;}
This is the message I wrote in LogToFile message box:
“current spread is, “+Spread