
Release of SQX 139 Dev 1 and what’s planned for year 2024
We’d like to announce the release of the new SX 139 Dev 1 version – note that this is a development version for testing, not the final 139 version. Most …
Přejít k obsahu | Přejít k hlavnímu menu | Přejít k vyhledávání
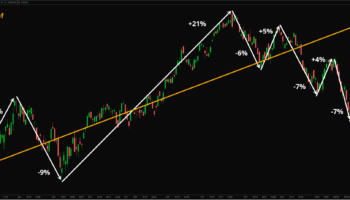
In this article we are going to show you how to build a simple semi-automatic trading system based on support and resistance levels (S/R levels). The system will have following characteristics:
What we need to do first is we setup our EA name and money-management rules. Here is how to do it:
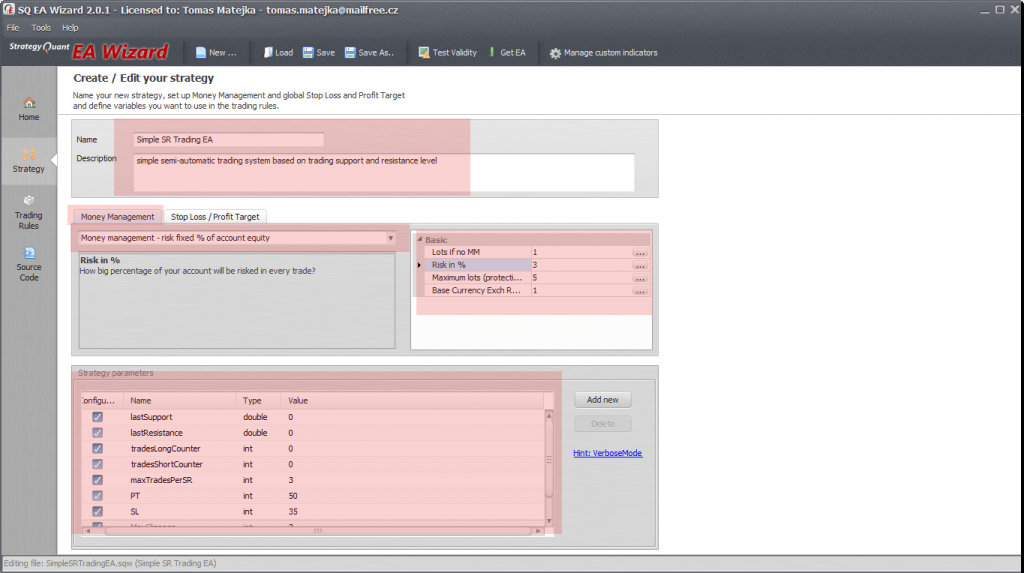
The most done in this step is obvious but let’s focus on variables for a moment. We will go through them while explaining the meaning:
lastSupport – this is the price entered for the S level. It will be automatically set on EA start and then can be modified by changing the parameter or modifying the support line directly on the chart
lastResistance – this is the price entered for the R level. It will be automatically set on EA start and then can be modified by changing the parameter or modifying the resistance line directly on the chart
tradesLongCounter – this variable will be used to store number of long trades realized with last set S/R level
tradesShortCounter – this variable will be used to store number of short trades realized with last set S/R level
NOTE: we incorporate these “trade counters” to limit maximum number of executed trades per each level defined. We need this to prevent over-trading while we expect no more than 3 trades at each S or R level set. We also need to reset this counters once we modify either the S or the R level to a new price so EA can start over.
maxTradesPerSR – the maximum number of trades allowed per each S/R level
PT, SL – these are distances of the stop-loss and profit-target orders expressed in number of pips
For the money-management rules we intend to risk no more than 3% of our account per each trade with the maximum possible size of 5 lots.
We also need to make sure the global money-management rules will work properly with our PT and SL sizes defined so let’s switch to the SL/PT tab:
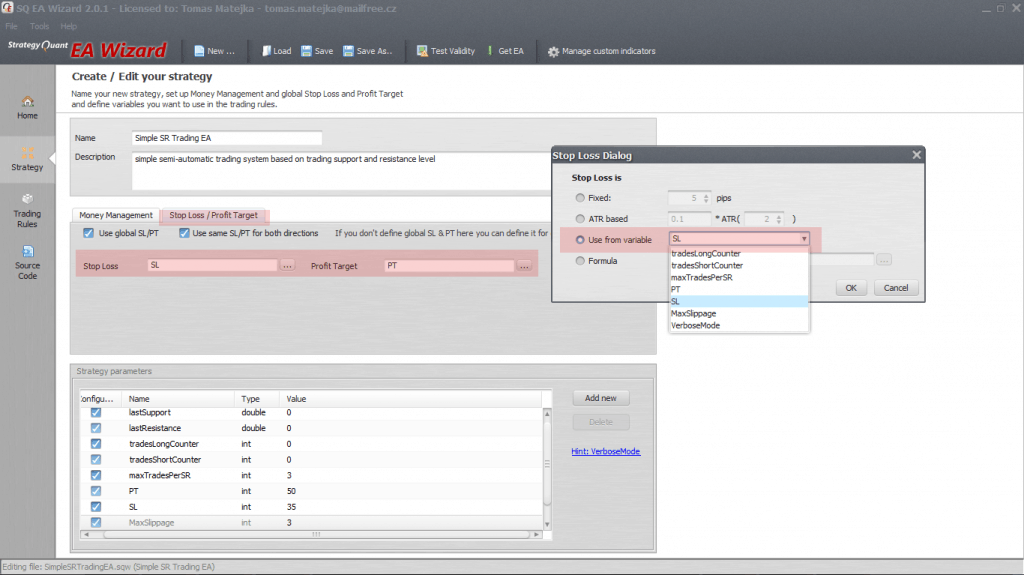
Once we have all necessary inputs defined we can move onto the very next task – creating rules and logic for EA itself.
We need our EA to have editable S/R prices (as inputs) but we still need the EA to work intelligently i.e. to draw horizontal lines even without entering any specific price values once we load our EA. Here is how to do that:
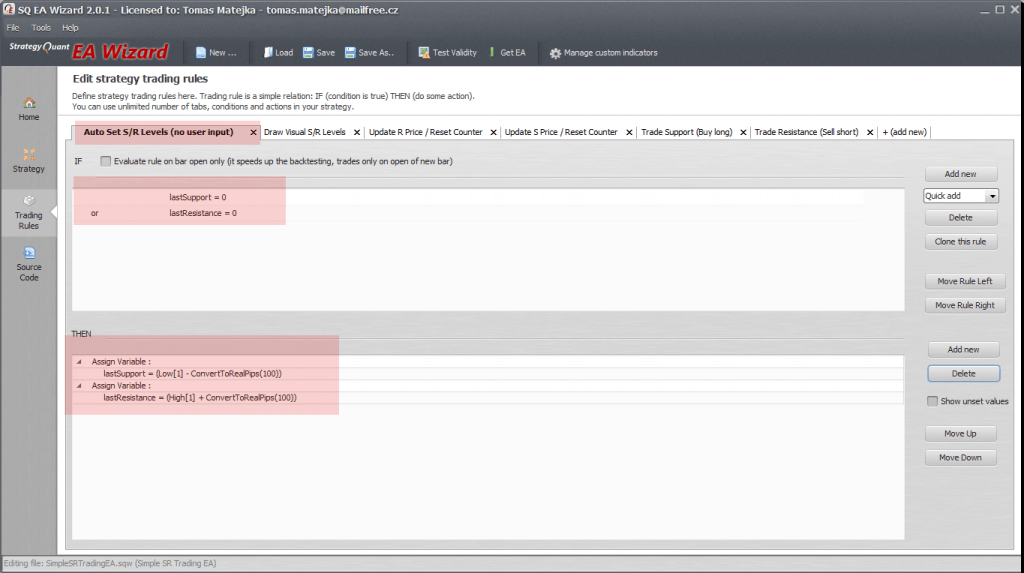
if LastSupport = 0 OR lastResistance = 0 – in case we did not set any specific price on EA load, let the EA to set it on its own then:
lastResistance = (High[1] + ConvertToRealPips(100)) and
lastSupport = (Low[1] – ConvertToRealPips(100))
If you do not set any specific price for the S or the R level at the moment you load the EA, EA will do it automatically by placing them 100 pips above the current high (for the R level) and 100 pips below the current low (for the S level). We are using the ConvertToRealPips(pips) function here to add and subtract 100 pips price range (pips has to be converted to a price difference for that purpose).
This is where the real power of EA Wizard comes into play. If you do not have certain function required available in EA Wizard you can simply add it by using custom MQL4 code.
We need to add a condition which checks whether any of those horizontal lines (R OR S) are already in place on the chart. We can use a handy function called ObjectFind(“object name”) for this (mind the quotes that have to be used here). If the lines do not exist on the chart (function ObjectFind returns number less than zero) we can draw them in the next step.
CustomFunction: ObjectFind(“resistance1”) < 0 OR
CustomFunction: ObjectFind(“support1”) < 0
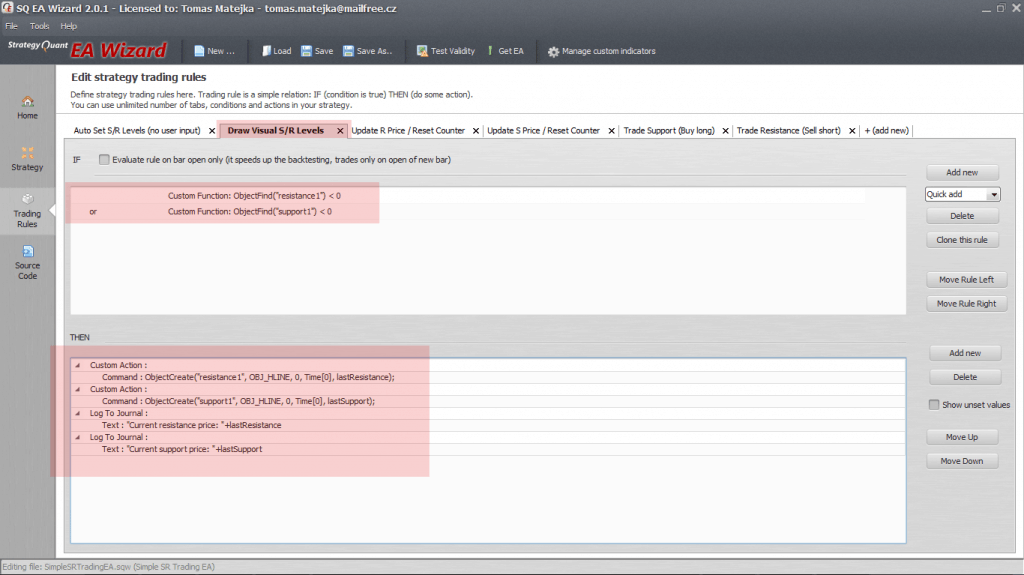
Custom Action: ObjectCreate(“resistance1”, OBJ_HLINE, 0, Time[0], lastResistance);
Custom Action: ObjectCreate(“support1”, OBJ_HLINE, 0, Time[0], lastSupport);
To draw the lines we used the ObjectCreate function as is defined in the MQL4 language manual to create new horizontal line objects.
The function requires several parameters:
“support1”, “resistance1” are names we used for our lines since each object in MetaTrader must have defined its own name.
OBJ_HLINE defines what kind of object we want to draw. In this case we need to draw a horizontal line
0 – “zero” value here stands for window index. 0 means the main chart we want to draw on
Time[0] – we are referencing the drawing point at very last bar
lastSupport and lastResistance are the prices we want our S/R lines to be displayed at
Note also we used Log To Journal function so we can monitor EA behavior during its operation. This is very handy function especially if you need to watch what happens with certain variables value
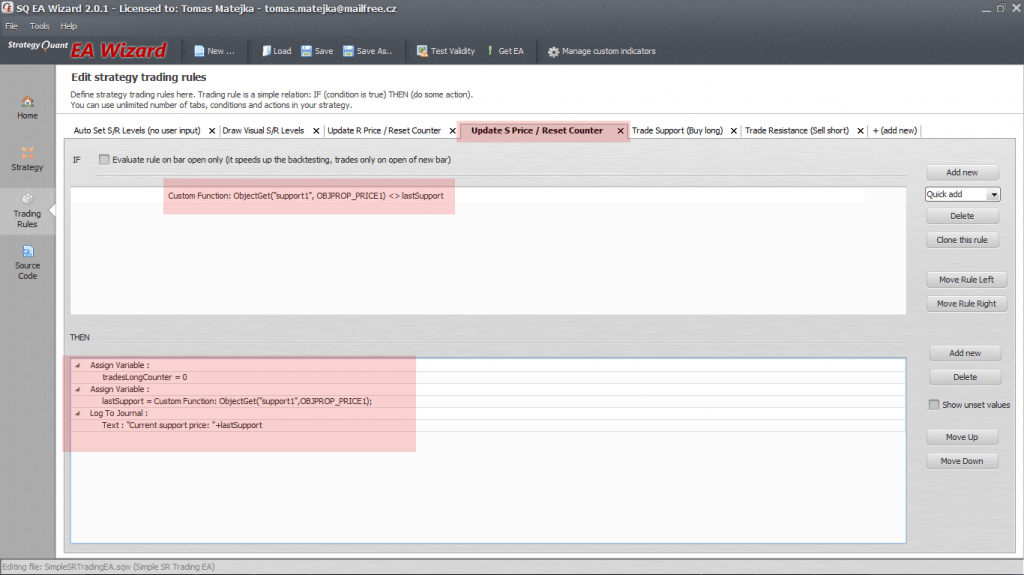
If you modify the S or the R level on the chart you need your EA to register that change. To achieve that we need to read current prices for both lines whether they correspond to lastSupport and lastResistance variables. Once we detect some change we need to update those variables.
Remember, once we update the S/R prices we also want to reset the trades counter so EA can freely trade the new price level up to pre-defined limit – maxTradesPerSR.
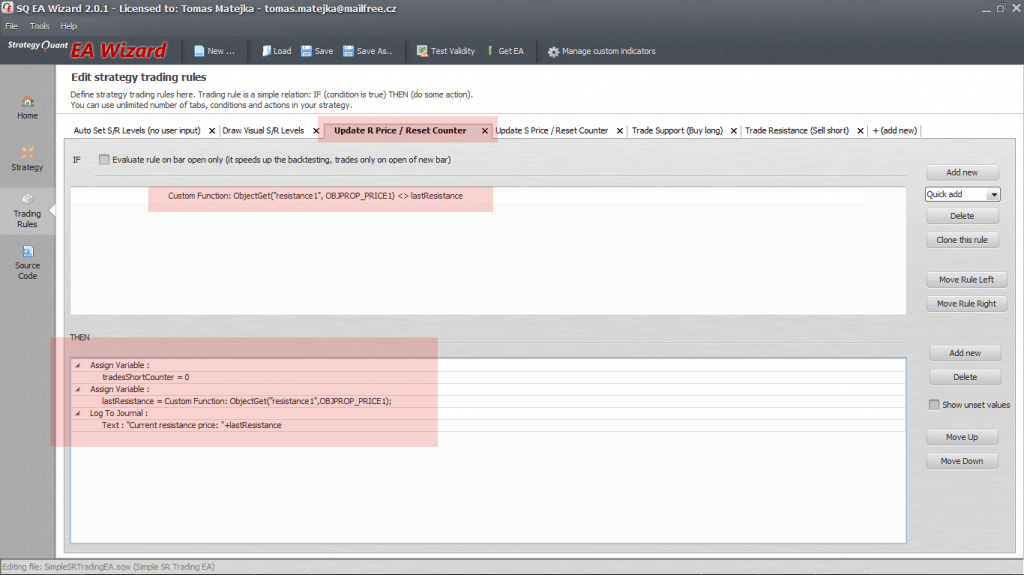
lastResistance = CustomFunction: ObjectGet(“resistance1”, OBRPROP_PRICE1);
We use another MQL4 function for that – ObjectGet(). This function allows to get information of a certain object property like the price for example. This function requires the object name and the correct property constant we are trying to obtain (in this case it is the main price – PRICE1).
And we do the same for our S level:
Once we have everything we need prepared we can start defining trading rules for both directions.
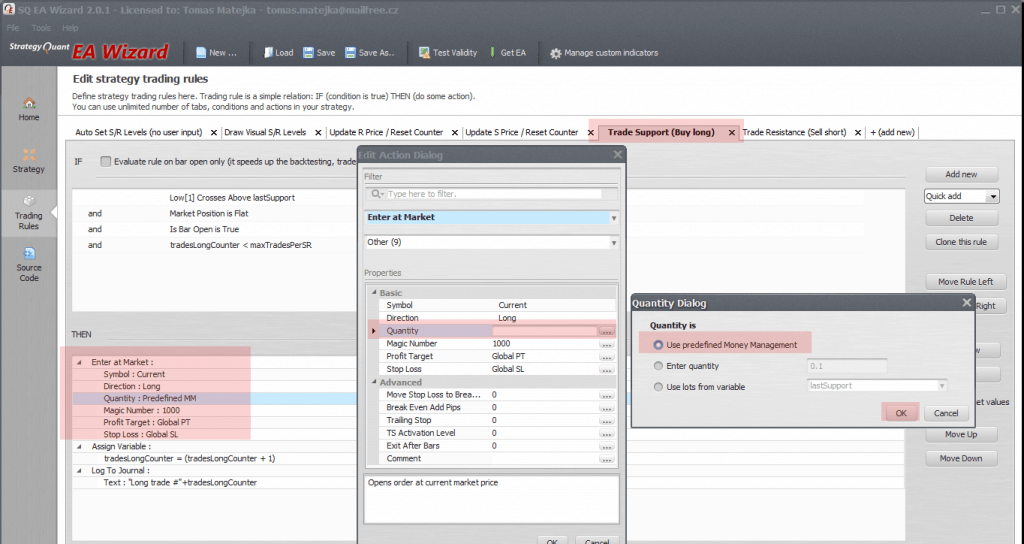
Let’s start with the long condition first:
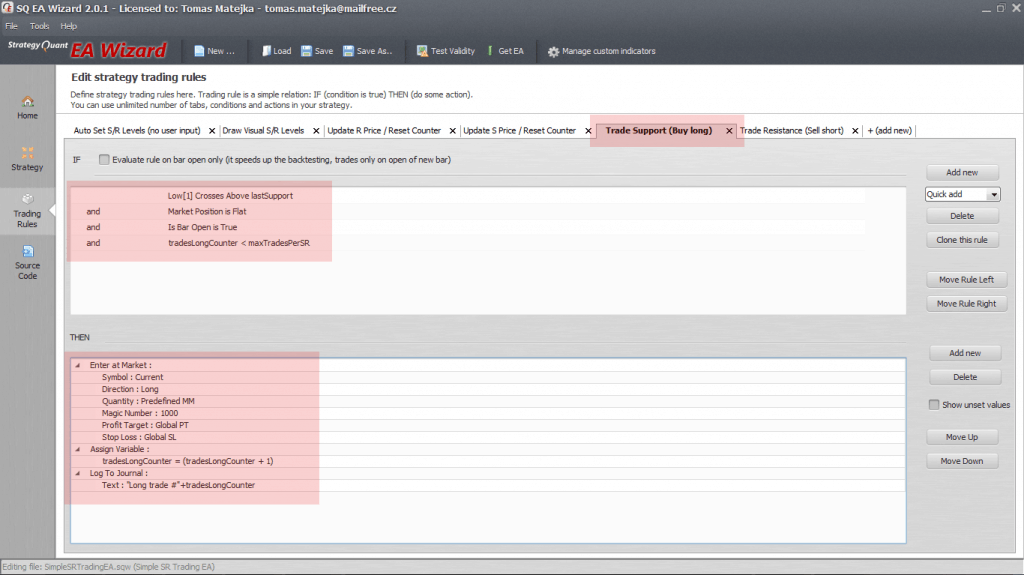
Low[1] Crosses Above lastSupport – for a valid long signal we consider a situation when low price crosses above defined S level
MarketPosition is Flat – there is no other existing position already opened
IsBarOpen is True – evaluate the condition only once per each bar
tradesLongCounter < maxTradesPerSR – trade only if the trade limit was not reached
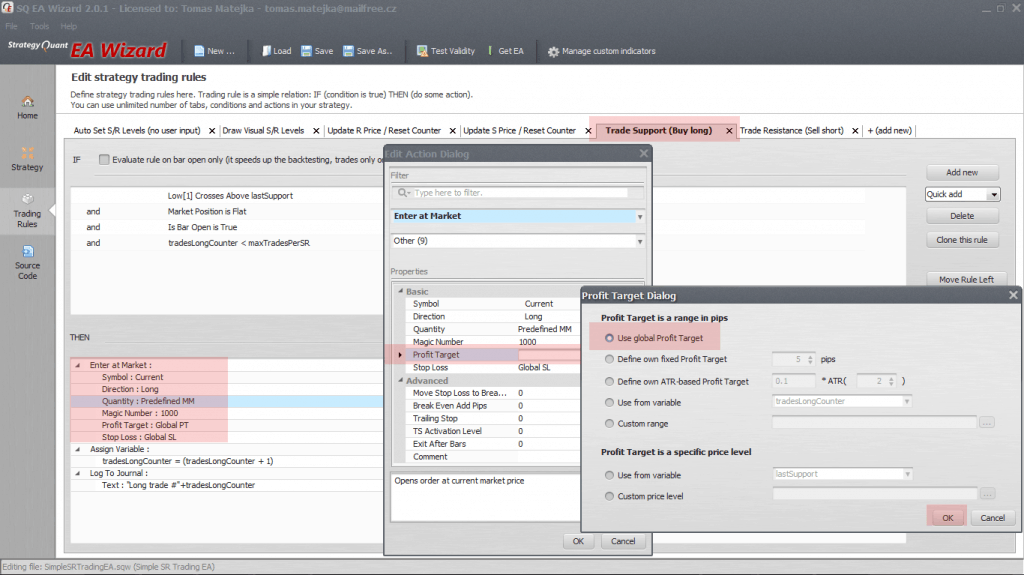
If the condition above becomes valid we can place a long market order with magic number 1000. We also have to increase the counter value for long trades by 1 (to count the very last long trade). This is done by using the Assign Variable and the Addition functions.
Do not forget to set PT and SL size properly also with the lot size for each trade as shown in the screenshot.
Now we need to do the same for the short side:
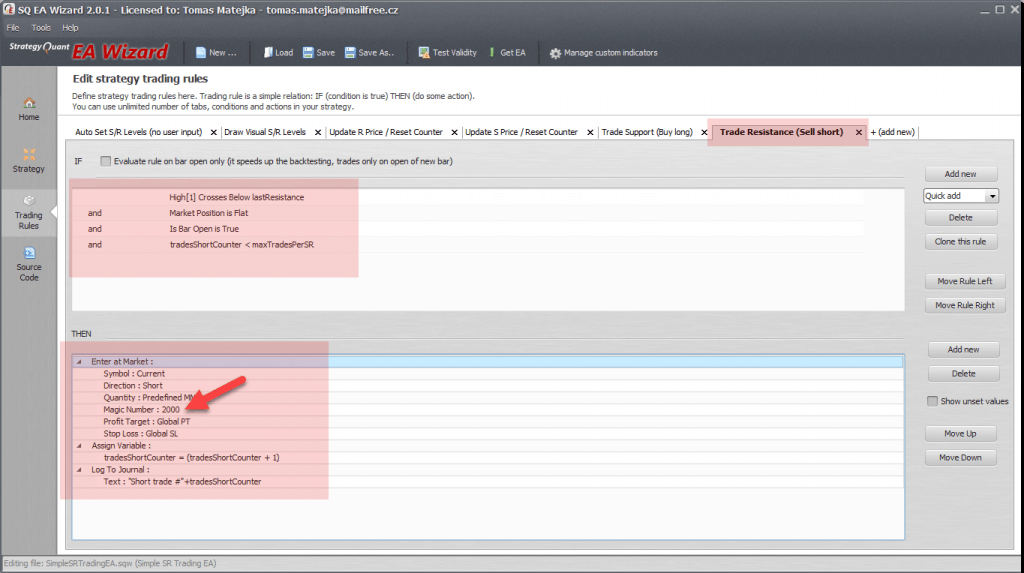
The main difference here lies within the cross condition. We want to see a bar High[1] to Cross Below our defined R level. For the short market order we also have to use a different magic number (2000 in our case) because in MetaTrader each order has to a unique magic number assigned.
At this point we have our EA complete. The very last step here is to export the code into an EA file and test the EA in MetaTrader4 using the backtester or the simulated regime.
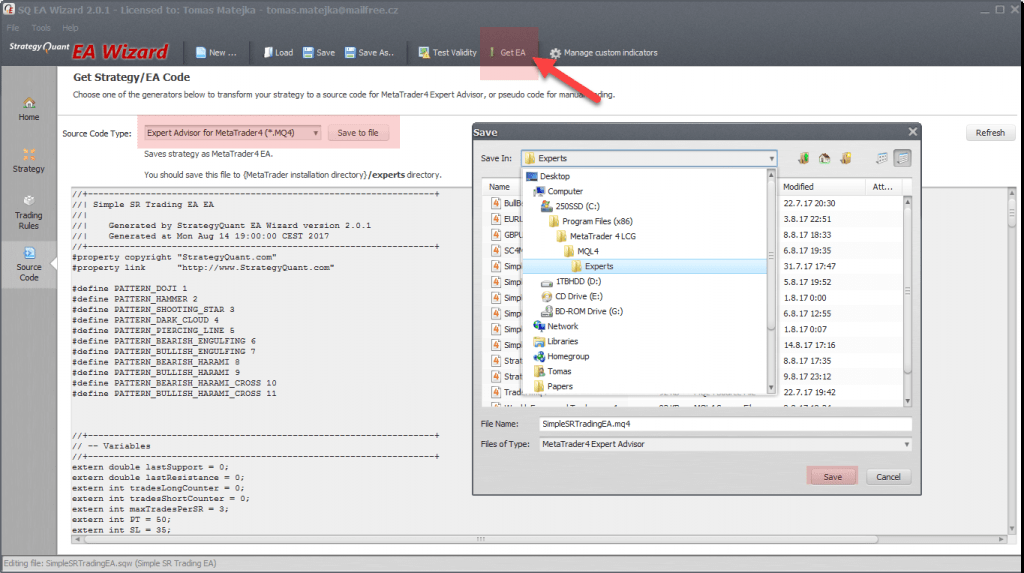
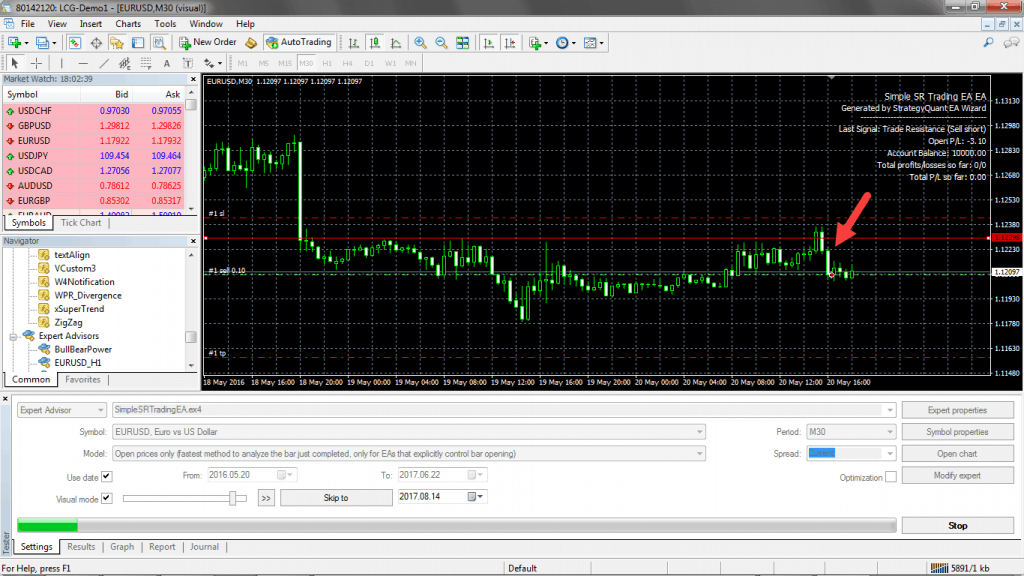
Once the EA is saved we can start the MT4 backtester to verify its function.
We’d like to announce the release of the new SX 139 Dev 1 version – note that this is a development version for testing, not the final 139 version. Most …

Dive into Algorithmic Trading Without the Coding Headache! Are you intrigued by algorithmic trading but dread the thought of coding? Today marks the beginning of our exciting series that’s about …
 Tomas Vanek
5. 3. 2024
In this interview, we catch up with Naoufel, a seasoned trader, to explore his journey through the stormy market of 2023. Naoufel is successful trader with verfied track record who …
 Ellie Souckova
12. 12. 2023
Will the EA Wizard be able to use a certain numbers of candles at specific hours ( if it is an hourly chart) to identify the support resistant levels and open and close trades based on these levels? For example, on an hourly chart, draw the resistant and support lines based on the highest high and lowest low of closed candles at 3am, 4am and 5am.
Hi Tomas262,
very good job, where can I find sqw file of this EA (support resistance trading system)?
regards
Christian
Great Article Tomas.
I am going to share with you one very simple strategy based on a strong and easily noticeable candlestick pattern. They call it “Lucky Spike”. Everyone can learn it, use it and make money with it. There are traders who make a living trading just this pattern. Just check out this ebook I am giving you for free:==> http://www.forexmystery.com?hgd4h84gdh
I am going to share with you one very simple strategy based on a strong and easily noticeable candlestick pattern. They call it “Lucky Spike”. Everyone can learn it, use it and make money with it. There are traders who make a living trading just this pattern. Just check out this ebook I am giving you for free:==> http://www.forexmystery.com?hgd4h84gdh