In this article, we introduce our new divergence comparison blocks—a tool designed specifically to identify and analyze divergences. These blocks aim to simplify the detection of potential trend reversals, helping traders recognize weakening momentum or emerging changes. In addition to a discussion on divergence theory and practical implementation tips, our main focus is on presenting this solution. Our divergence comparison blocks offer a clear and efficient method to analyze market data, ultimately streamlining decision-making for traders and technical analysts.
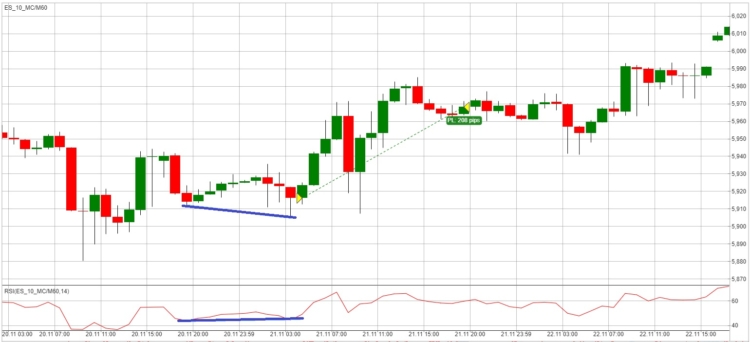
In the image above, we see an example of bullish divergence between the RSI indicator and price on a 10-minute E-mini S&P chart.
What Are Divergences?
In technical analysis, a divergence occurs when the price action of an asset and a technical indicator (commonly one that measures momentum, such as RSI or MACD) move in opposite directions. In other words, while the price may be making new lows or highs, the indicator fails to follow suit. This discrepancy can signal that the prevailing trend is weakening, hinting at a potential reversal or a period of consolidation.
Types of Divergences
- Bullish Divergence:
Occurs when the price makes a lower low, but the indicator forms a higher low. This suggests that, despite falling prices, the underlying momentum is improving, potentially indicating a reversal to an uptrend.
- Bearish Divergence:
Takes place when the price records a higher high, while the indicator shows a lower high. This misalignment hints that even though prices are rising, the momentum is waning, possibly signaling an impending downtrend.
The Role of Divergences in Trading
Divergences serve as a valuable early warning system by highlighting potential changes in market direction. By comparing price behavior with the movement of a momentum indicator, traders can:
- Identify Potential Trend Reversals: Detect early signs that the current trend is losing strength.
- Enhance Trade Entry and Exit Timing: Use divergence signals as an additional confirmation layer before committing to a trade.
- Improve Risk Management: Adjust positions proactively in response to emerging changes in market momentum.
It’s important to note that divergences are not foolproof and should be combined with other technical tools and sound risk management practices.
How Divergence Blocks Are Implemented in the StrategyQuant
The divergence blocks are implemented as comparison blocks. In StrategyQuant X, comparison blocks are essential tools used to compare different indicators, prices, or values on a chart. They help define conditions that can trigger buy or sell signals in an automated trading strategy. For example, a comparison block can check if a short-term moving average crosses above a long-term moving average, signaling a potential buy opportunity.
Comparison blocks act like decision-making checkpoints, answering questions such as “Is one value higher than another?” or “Has an indicator crossed a key threshold?” By combining multiple comparison blocks, traders can create sophisticated rules to refine their strategies and improve decision-making based on market conditions.
There are several types of comparison blocks designed to help traders build automated trading strategies by comparing different indicators, prices, or custom values. These blocks allow for flexible and precise control over when certain conditions are met.
Here are the main types of comparison blocks available in StrategyQuant X:
- Crosses Above / Crosses Below
- Greater Than / Less Than
- Equal To / Not Equal To
- Greater Count / Lower Count
- Greater Percentile / Lower Percentile
- Greater Than or Equal To / Less Than or Equal To
- Is True / Is False
How does the identification of divergences between an indicator and the price work?
Let’s talk about the bullish divergence…
Finding Lows
Identifying Local Minimums:
The system examines a series of data points—whether from the asset’s price or a momentum indicator—to pinpoint local lows. A local low is identified by comparing a value with its immediate neighbors. If the current value is lower than both the preceding and following values, it qualifies as a local minimum.
Separate Analysis for Price and Indicator:
- Price Data: The method scans through the price series, marking moments when the price dips locally.
- Indicator Data: The same logic applies to momentum indicators, with an additional step: values are rounded to a fixed number of decimal places (using a specified precision). This rounding smooths out minor fluctuations, ensuring the analysis isn’t distorted by insignificant noise.
Evaluating Divergence
Comparing Two Consecutive Lows:
After detecting the two most recent lows in both the price and indicator data, the system compares these lows to evaluate the trend:
- For Price: It confirms that the most recent low is lower than the previous low, which indicates a continuing downtrend in price.
- For the Indicator: It checks that the recent low is higher than its preceding low, suggesting that the underlying momentum is beginning to improve.
The Divergence Signal:
When these conditions are met—declining prices combined with an improving momentum indicator—the system identifies a bullish divergence. This mismatch often hints that the downtrend is losing steam, setting the stage for a potential reversal.
Key Parameters of Divergence Blocks
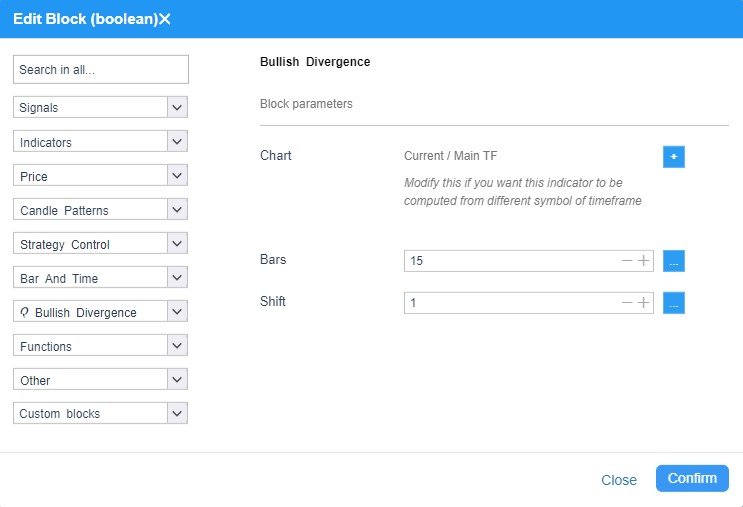
In the image above, you can see the basic parameters of the divergence blocks.
Understanding and fine-tuning specific parameters is crucial for accurate divergence detection:
- Shift:
The shift parameter sets the starting point (or offset) in the data series from which the system begins its analysis. This can be useful for excluding early data points or aligning the analysis with more relevant market segments.
- Bars:
Representing the number of data points (or “bars”) considered, this parameter defines the window of analysis. A broader bars setting might capture more data for a robust analysis, whereas a narrower window can yield more responsive signals.
Adjusting these parameters allows traders to tailor divergence detection to their specific strategies and market conditions, balancing between sensitivity and reliability.
Trading Divergences: Strategies and Considerations
Trading Setup
- Entry Signal:
A bullish divergence may prompt a trader to consider entering a long position, especially when supported by additional indicators like trendlines, volume analysis, or candlestick patterns.
- Confirmation:
Divergence signals should ideally be confirmed by other technical signals. Relying solely on divergence can be risky, as no single indicator guarantees a trend reversal.
Limitations and Pitfalls
- False Signals:
In strong, sustained trends, divergences can occur without resulting in an actual reversal, potentially leading to premature entries or exits.
- Time Lag:
By the time a divergence is confirmed, the trend reversal may have already started.
- Indicator Sensitivity:
The effectiveness of divergence detection is highly dependent on the chosen indicator and its settings. Adjusting the precision and bars parameters can significantly influence outcomes.
How to Use Divergence Comparison Blocks in StrategyQuant X
Importing the Block:
A guide on how to import the snippet can be found in the Codebase section here.
Using Divergence Comparison Blocks in the Builder:
After a successful import, you can use the new divergence comparison blocks in the Builder. In the Builder, these blocks can be enabled under Builder / Blocks.

The image above shows comparison blocks in the Builder section of StrategyQuant.
AlgoWizard – Building Custom strategies
AlgoWizard in StrategyQuant is a Drag & Drop Builder that allows users to create strategies by selecting and combining various conditions. Divergence comparison blocks can be utilized by choosing the desired divergence block from the comparison blocks, adding an indicator, setting its period, and configuring additional logical conditions for the strategy.
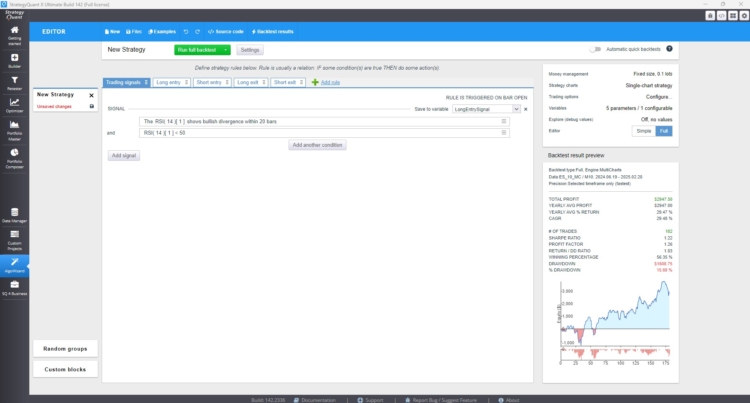
In the image above, I see a screenshot from AlgoWizard showing a simple strategy based on bullish divergence.
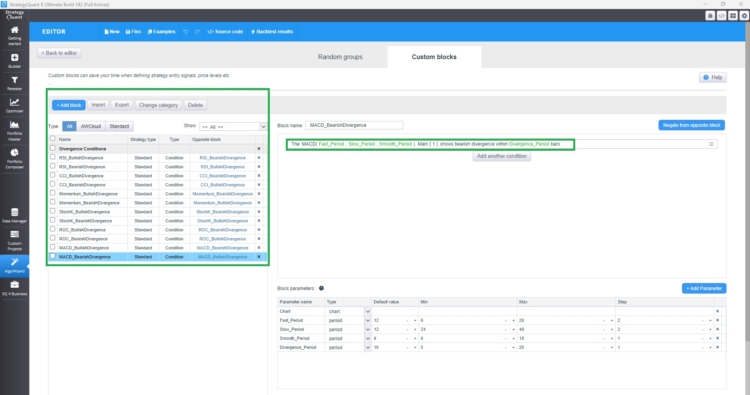
AlgoWizard – Custom Blocks
Above you can see a simple only long strategy built on the divergence between RSI and price.
Custom blocks in StrategyQuant X allow traders to create personalized building blocks for their rading strategies without needing to code. With divergence comparison blocks, traders can define conditions that compare market divergences relative to key indicators. This allows for identifying overbought or oversold conditions dynamically. Once created, custom blocks are seamlessly integrated into AlgoWizard, StrategyQuant’s visual strategy builder, to construct complex and adaptive trading strategies.
Custom blocks enhance flexibility by allowing you to parameterize key metrics—such as indicators, their periods, shofts —providing more control over your strategy’s behavior. In summary, custom blocks enable more precise, dynamic, and sophisticated trading strategies. Divergence comparison blocks, in particular, are highly recommended for use in AlgoWizard as either custom blocks. Because these blocks require careful configuration, it’s beneficial to create custom blocks where each setting follows a logical structure. While creating strategy templates is a more advanced topic, these blocks are ideal for such strategies. In the next article, we’ll provide a detailed tutorial on how to use them.
For now, I have prepared several custom blocks based on this divergence condition. You can download them using this link and import them by following the provided steps.
AlgoWizard – Templates
This is a more advanced topic that we will cover in greater depth in an upcoming article. By combining custom blocks and random groups, you can create a prototype strategy and instruct SQX to search for specific types of strategies.
Conclusion
Divergences are a powerful tool in the technical trader’s arsenal, offering valuable insights into market momentum and potential trend reversals. By understanding both bullish and bearish divergences, and by fine-tuning key parameters like shift, and bars, traders can enhance their ability to spot hidden market signals and make more informed decisions.
Integrating divergence analysis with other technical methods can provide a more holistic view of market dynamics, ultimately leading to smarter trading strategies. For further insights and in-depth discussions on advanced trading techniques, be sure to explore additional resources on the StrategyQuant Blog.