Think trend reversals are hard to trade?
Many traders struggle to catch reversals early — either they enter too late, or get caught in false signals. But there’s a classic price action setup that’s stood the test …
 Tomas Vanek
28. 7. 2025
Přejít k obsahu | Přejít k hlavnímu menu | Přejít k vyhledávání
Want to level up your trading? These indicators adjust to the market’s mood swings like a pro.
Most old-school indicators have a big flaw: they don’t care if the market’s going wild or just chilling. A simple moving average treats every price the same, whether the market’s trending hard or stuck in a rut. Oscillators? They’re often stuck with the same settings, no matter how crazy or calm things get.
Adaptive indicators fix that. They tweak themselves based on what the market’s doing—speeding up when it’s trending, slowing down when it’s choppy, or adjusting to sudden volatility spikes. Here’s what they bring to the table:
Let’s dive into four awesome adaptive indicators in StrategyQuant: VIDYA, VMA, VST, and HalfTrend. Each one’s got its own vibe, but they all adapt to the market like a seasoned trader.
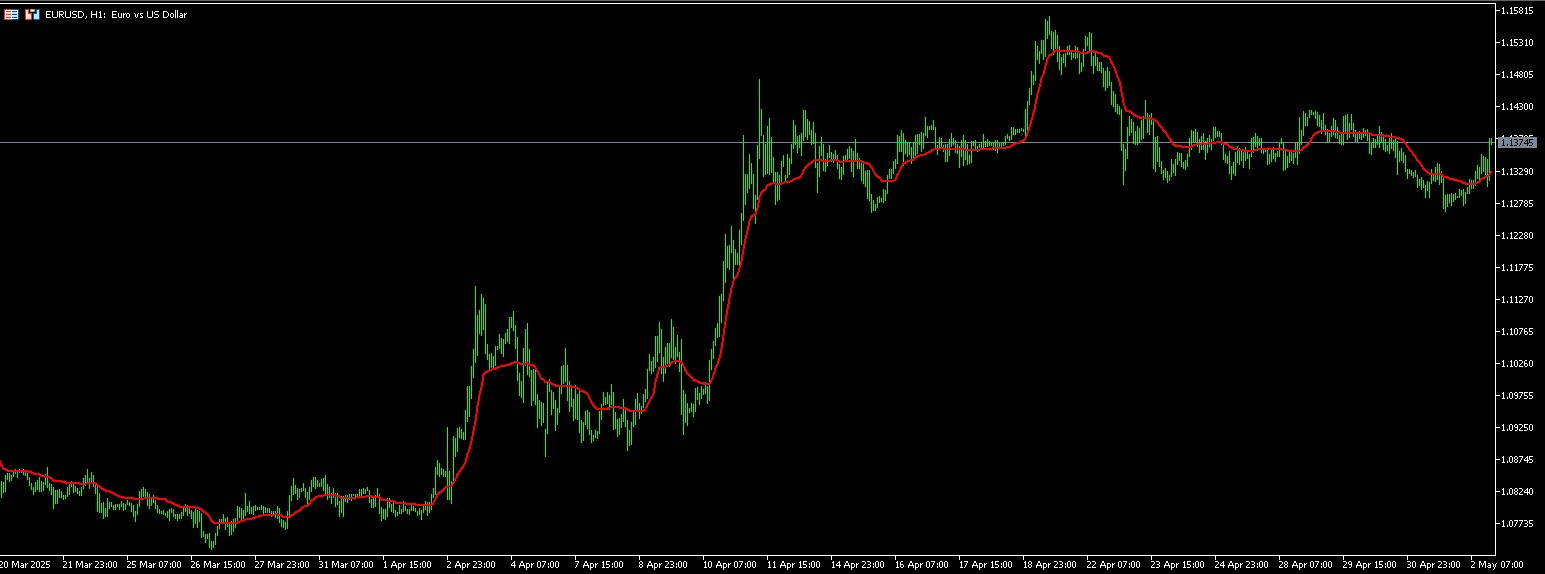
VIDYA, or Variable Index Dynamic Average, is a moving average that changes its speed based on how wild the market is. Tushar Chande came up with it, and it’s like an EMA that knows when to hustle or chill.
VIDYA takes a regular Exponential Moving Average and tweaks it using the Chande Momentum Oscillator (CMO). When the market’s volatile, it gets more sensitive. When things are quiet, it dials back to avoid overreacting.
Here’s the gist of how it’s calculated in StrategyQuant:
You’ve got two main settings to play with:
There are preset combos like Period=9/CMOPeriod=9 or Period=50/CMOPeriod=9, so you can tweak it for short-term trades or longer swings.
You can download the indicator here.
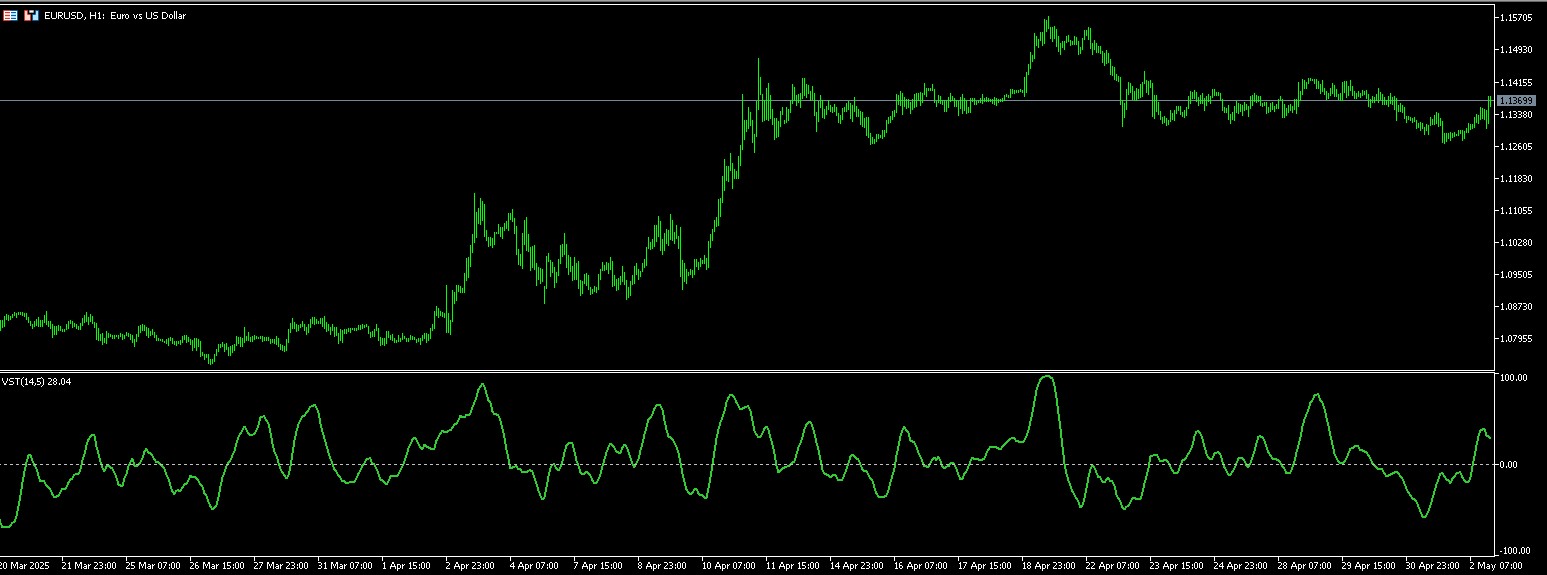
Another Tushar Chande creation, the Variable Moving Average (VMA) focuses on how “efficiently” prices are moving. It’s less about volatility and more about whether the market’s got a clear direction or is just wandering.
Efficiency is about how straight the price moves. High efficiency means it’s trending smoothly with little back-and-forth. Low efficiency? It’s bouncing around without going anywhere. VMA uses an Efficiency Ratio to measure this—net price change divided by total movement.
VMA adjusts its speed based on that Efficiency Ratio:
The math in StrategyQuant looks something like this:
You get two knobs to turn:
Presets include stuff like Period=14/VolFactor=2 or Period=14/VolFactor=4 for more responsiveness.
You can download the indicator here.
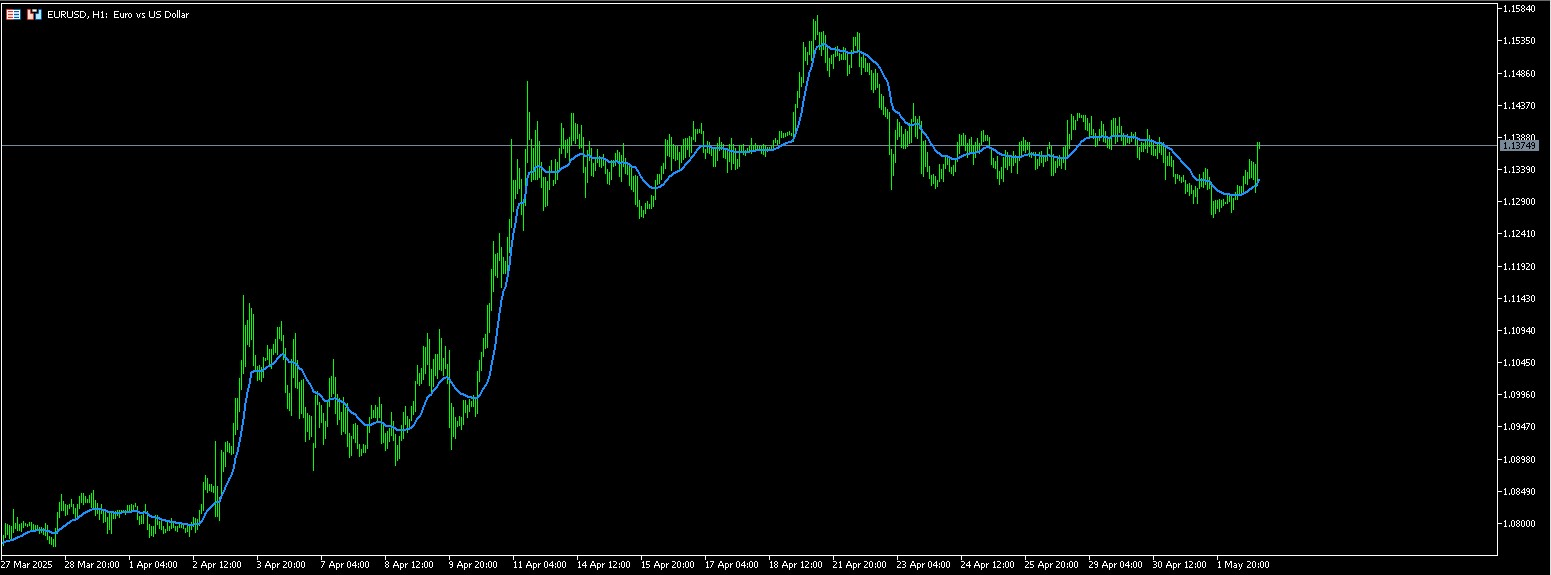
VST is a cool oscillator that spots when upside or downside volatility is taking over. Instead of just looking at price or total volatility, it digs into whether bulls or bears are driving the action.
Markets don’t always move symmetrically. Sometimes upside moves are stronger (bullish skew), sometimes downside dominates (bearish skew), or it’s balanced (neutral). VST turns this into a number from -100 (super bearish) to +100 (super bullish).
It’s a bit of a process:
The StrategyQuant math breaks it down like:
Two settings to tweak:
Presets like LookbackPeriod=14/SmoothingPeriod=5 are snappy, while LookbackPeriod=34/SmoothingPeriod=13 is smoother.
You can download the indicator here.
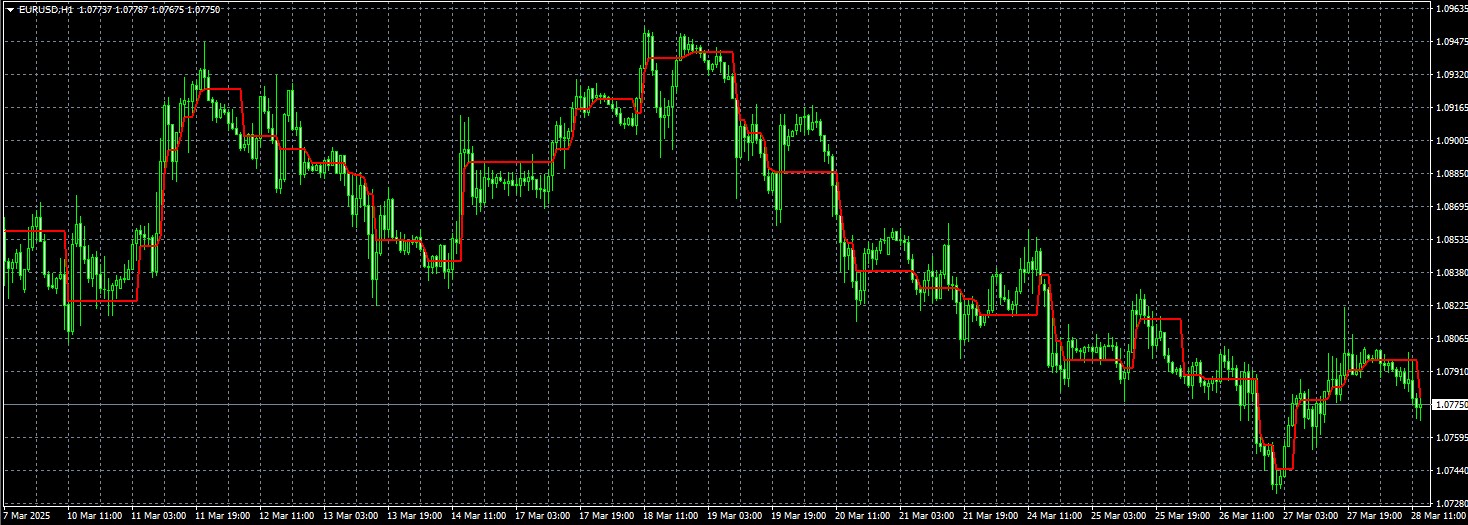
HalfTrend is like a Swiss Army knife for trend-following. It mixes moving averages, breakout signals, and volatility-based stops into one clean indicator that shows trend direction and key levels.
Unlike rigid trend indicators, HalfTrend adapts by:
Here’s the flow:
In StrategyQuant, it’s like:
Two settings:
Presets like AtrLength=10/Amplitude=2 are quick, while AtrLength=50/Amplitude=5 is more stable.
You can download the indicator here.
Each indicator’s got its own strengths, so it depends on your trading vibe.
You’re trading markets that swing between calm and crazy, like stocks or indices. It’s great for catching momentum early and staying chill during consolidation.
You want to know how strong a trend is. It’s perfect for forex pairs with clear trends and works well in both trending and ranging markets.
You’re into spotting hidden signals. VST’s awesome for catching trend shifts early or finding divergences, especially in markets with big players creating skew.
You want clean trend signals with built-in support/resistance. It’s great for traders who need a balance of speed and stability.
These indicators are strong solo, but together? Dynamite.
Use VIDYA for the main trend and VST to check if the trend’s got legs. When both agree (rising VIDYA, positive VST), it’s a green light. Divergences? Watch out for reversals.
VMA keeps you in high-quality trends, while HalfTrend spots trend changes fast. Enter when they align, use HalfTrend as a trailing stop, and let VMA confirm the big picture.
These indicators adapt, but you can tweak their settings for specific markets.
Check longer timeframes for the big trend, medium ones for pullbacks, and short ones for entries. When indicators align across all three, it’s a solid setup.
Use HalfTrend’s ATR for stop placement. Trade bigger in low-volatility trends, smaller when things are wild or trends are weak.
If price is making new highs but VIDYA’s slowing down, or VST’s showing weak bullish skew, it could mean a reversal’s coming.
It’s a solid mix of fast signals and smooth trend-following.
This catches overextended moves in choppy markets.
Adaptive indicators are like having a trader’s sixth sense. They don’t just follow price—they read the market’s mood, from volatility to trend strength. With StrategyQuant’s VIDYA, VMA, VST, and HalfTrend, you’ve got tools to spot trends early, dodge fakeouts, and adapt to whatever the market throws at you.
Whether you’re trading stocks, forex, or crypto, these indicators can make your strategies sharper. Mix them, tweak them, and experiment to find what clicks for you.
Many traders struggle to catch reversals early — either they enter too late, or get caught in false signals. But there’s a classic price action setup that’s stood the test …
Tomas Vanek28. 7. 2025
Great news for all German-speaking traders!Our brand-new YouTube channel in German is now live – and it’s designed especially for you. 👉 Why should you check it out?If you’ve always …
Tomas Vanek26. 6. 2025
Ever wished you could build trading strategies effortlessly across platforms like MetaTrader 4, MT5, TradeStation, or MultiCharts? Our latest video unveils the brand-new AI Assistant update—now available for all engines …
Tomas Vanek17. 6. 2025
I am unable to locate these indicators in StrategyQuant?
hi have a look into our codebase https://strategyquant.com/codebase/ht-halftrend/
Hi, I wanted to know if it’s possible to have an example of this mix of indicators on Strategy Quant. Thanks.
There is no .mq4 file in the HalfTrend zip file. Does that mean there is no need to add indicators in MT4?