Trading smart means making the most of your time and resources, especially when comparing your current trading results with historical data. That’s where Quant Analyzer steps in, offering a streamlined way to see how your live trading strategies stack up against your backtests. This comparison is crucial because it highlights what’s working, what’s not, and where you can improve.
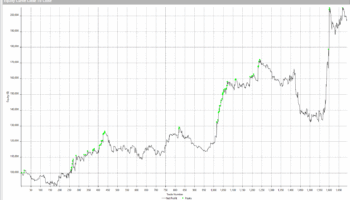
Organizing your data is the first step. Keep your live results and backtests in separate folders, and name them clearly for easy reference. With everything in order, Quant Analyzer can swiftly draw comparisons, using charts to show how your live trades perform against past simulations. This visual aid is a game-changer, making it simple to spot differences and adjust your strategies for better outcomes.
The best part? You don’t need to dig through mountains of data yourself. Quant Analyzer does the heavy lifting, allowing you to focus on refining your strategies and making more informed trading decisions. This not only saves time but also enhances your trading efficiency.
For those eager to see Quant Analyzer in action and learn more about maximizing your trading strategies, the full video walkthrough is available on our YouTube channel. Dive in to discover how this tool can transform your trading analysis, making it more effective and less time-consuming.


very interesting ! thank you