We have added several new indicators and snippets to the sharing server in recent months. In today’s blog post, we’ll briefly go through each of them.
TTM Squeeze
TTM Squeeze is a volatility and momentum indicator introduced by John Carter. It uses the tendency of prices to break out sharply after consolidation in a narrow trading range.
The volatility of the TTM Squeeze indicator is determined by Bollinger Bands and Keltner Channels. When the Bollinger Bands are within the Keltner Channels, it indicates a period of very low volatility. This condition is referred to as a squeeze. The squeeze line of the TTM Squeeze indicator has a value of 1. When the Bollinger Bands expands and moves back outside the Keltner Channel, the squeeze means that volatility is increasing and prices are likely to break out of this narrow trading range in one direction or the other. In this case, the squeeze line of the TTM Squeeze indicator has a value of 0.
The TTM Squeeze indicator also uses a momentum oscillator to indicate the expected direction of the move when the squeeze breaks out. This line oscillates around the zero line. Increasing momentum above the zero line indicates a buying opportunity, while momentum falling below the zero line may indicate a selling opportunity.
The indicator has two lines:
- Squeeze
- Momentum
We have added these basic conditions:
- TTM Squeeze Momentum crosses Level UP/Down ( while the market is in squeeze)
- TTM Squeeze Momentum falling/rising ( while the market is in squeeze)
You can download the indicator and conditions here
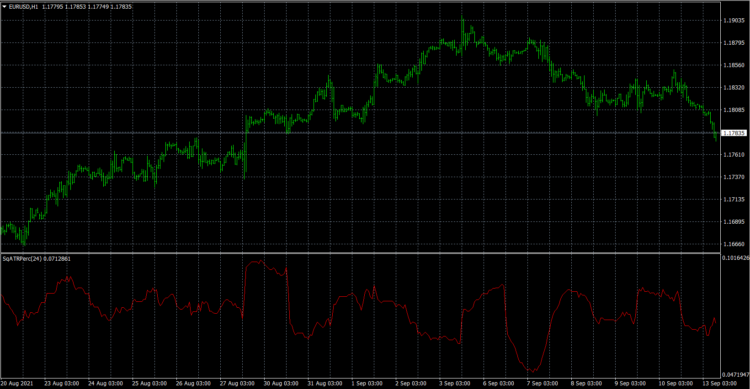
ATR Percent
Average True Range Percent (ATRP) expresses the Average True Range (ATR) indicator as a percentage of a bar’s closing price.
- ATR Percent can be used to measure volatility, just like the Average True Range (ATR) indicator. ATR Percent allows you to compare securities, which ATR does not.
- ATR Percent measures volatility on an absolute level, meaning stocks with lower prices have lower ATR values than stocks with higher prices. ATR Percent displays the indicator as a percentage so that securities with different prices per share can be compared.
Good explanation of using ATR percent you can find here in this Darwinex video. Martin Tinsley explains in detail when and how to use it.
We have added these basic conditions:
- ATR Percent above/below Level
- ATR Percent rising/falling
You can download the indicator and conditions here.
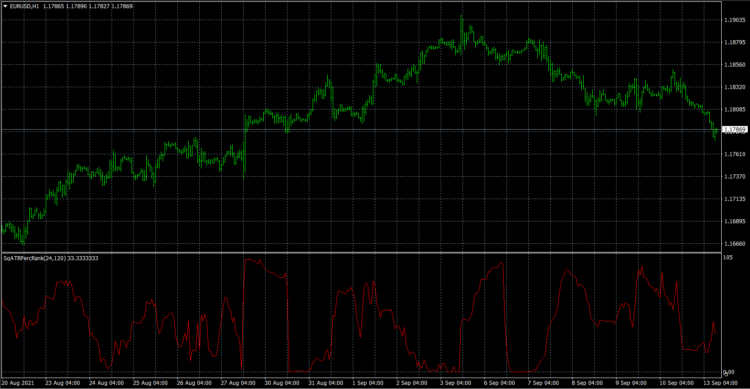
ATR Percent Rank
ATR percentile rank indicates the percentile rank of the current Average True Range compared to the X previous periods.
This is a simple form of value normalization and gives you a better idea of the current volatility. You can read more about the percentile rank on the Wikipedia page or in this BeyondBacktesting.com article.
ATR Percent Rank can be used to identify the change in the market regime from a zone of low volatility to a zone of high volatility and vice versa.
The indicator has two parameters
- ATR Period
- Percent Rank Period
We have added these basic conditions:
- ATR Percent Rank above/below Level
- ATR Percent rising/falling
- ATR Percent Rank crosses above/below Level
You can download the indicator and conditions here.
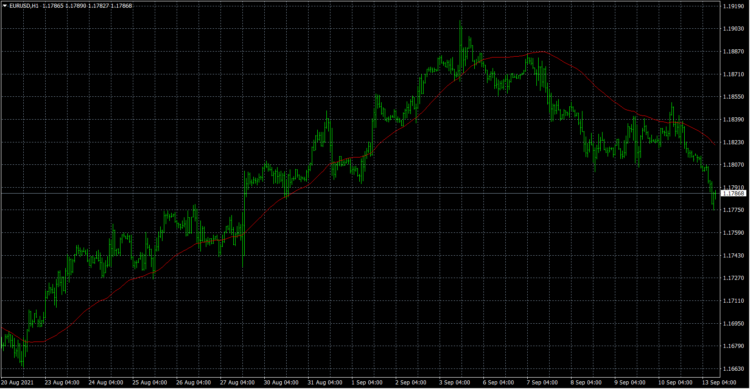
DEMA
The DEMA uses two exponential moving averages (EMAs) to eliminate lag because some traders consider lag to be a problem. The DEMA is used in a similar way to traditional moving averages (MA). The average helps confirm uptrends when the price is above the average and downtrends when the price is below the average. When the price crosses above the average, it can be a sign of a change in trend. Moving averages are also used to indicate areas of support or resistance.
Indicator hast one parameter
We have added these basic conditions:
- DEMA is falling/rising
- Slow DEMA and Fast DEMA is rising/falling
You can download the indicator and conditions here.
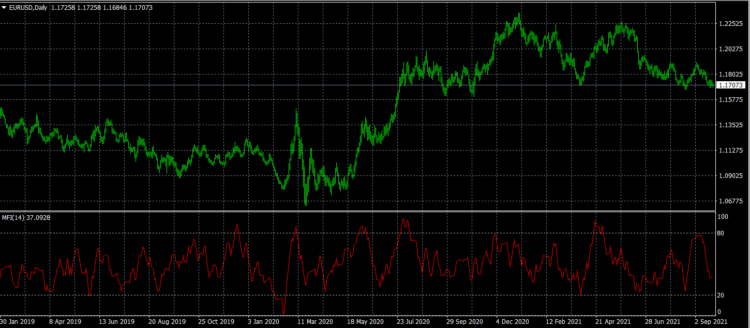
Money Flow Index
The Money Flow Index (MFI) is a technical oscillator that uses price and volume data to identify overbought or oversold signals in an asset. It can be used also to detect divergences that warn of a change in trend in price. The oscillator ranges from 0 to 100.
Unlike traditional oscillators such as the Commodity Channel Index, Relative Strength Index …, the Money Flow Index takes into account both price and volume data, not just price.
The indicator is implemented in the same way as in MT4/MT5.
The indicator has one parameter
We have added these basic conditions:
- MFI is rising/falling
- MFI is above/below the level
- MFI crosses above/below the level
You can download the indicator and conditions here.
David Varadi Oscillator
The Varadi Oscillator (VDO) is a leading indicator first proposed by David Varadi, originally aimed at reducing the influence of the trend component in oscillators. The DVO can be described as a rolling percentage rank of detrended prices over a specified look-back period. The detrending procedure used to calculate the indicator is based on the simple moving average of the ratio between the closing price and the median price (( High+ Low) / 2 ). Both the length of the percentage range and the moving average used for detrending can be adjusted in SQX.
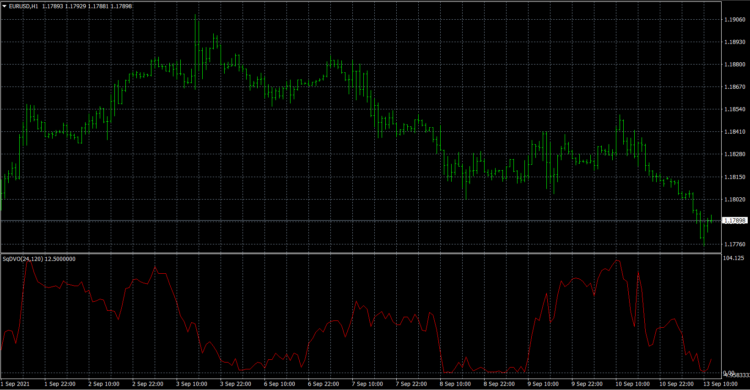
The indicator has two parameters
- SMA Period
- Percent Rank Period
We have added these basic conditions:
- MFI is rising/falling
- MFI is above/below the level
- MFI crosses above/below the level
You can download the indicator and conditions here
We have also added more databank columns snippets to the sharing server, which you can find here.


Excellent !!!!! good idea !!!! SQX need blocks. thank you . this is a good article !!
Thanks for the good work and publication!
No indicators with the MFI download