We have added several new indicators and snippets to the sharing server in recent months. In today’s blog post, we’ll briefly go through each of them.
Rate Of Change – ROC
The rate-of-change indicator (ROC), also referred to simply as momentum, is a pure momentum oscillator that measures the percentage change in price from one period to the following one. When calculating ROC, the current price is compared to the price “n” periods ago. The chart forms an oscillator that fluctuates above and below the zero line as the rate of change moves from positive to negative. As a momentum oscillator, ROC shows signals such as crossing the centerline, divergences, and overbought/oversold levels. Since divergences are not reversal signals in most cases, they will not be discussed in detail in this article. Although crossing the center line causes price fluctuations, especially in the short term, these crossovers can be used to identify the overall trend. The identification of overbought or oversold extremes is natural for the Rate-of-Change Oscillator
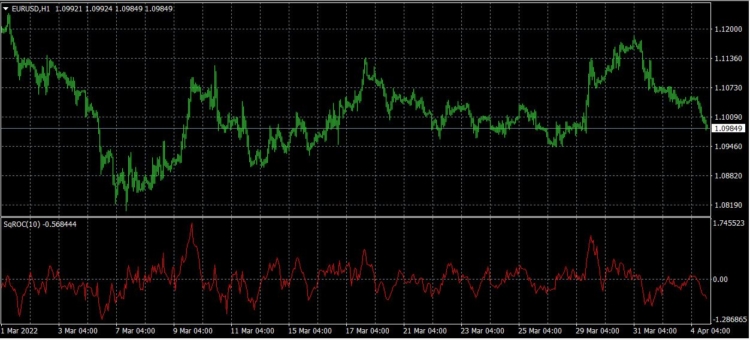
The indicator has one line:
- ROC
We have added these basic conditions:
- ROC is rising/falling
- ROC is above/below level
- ROC crosses above/below level
Indicator is implemented for: MT4/MT5/Tradestation/ Multicharts
You can download the indicator and conditions here
Disparity Index – DI
The Disparity Index (DI) is a technical momentum indicator that measures the percentage value of an asset’s current closing price relative to its moving average. Simply put, it helps compare the current market price to the moving average of the price over some time. A positive percentage indicates a rising price, while a negative percentage indicates a falling price. Traders use the DI to identify overbought/oversold market conditions of an asset, which can lead to sudden price reversals.
Whenever the disparity index crosses the zero line, the indicator generates very useful signals. A change in trend is imminent when the indicator crosses the 0 line. A price correction is inevitable when the indicator shows extreme values. The DI indicator shows extreme values because assets are falling into the overbought/oversold zone. Extreme values indicate that a trend reversal is imminent and traders should stop following the trend. Values above zero indicate an uptrend, while values below zero indicate selling pressure during the downtrend. Divergences can also be detected using the DI indicator. Whenever the indicator and the price do not move in the same direction, this indicates a divergence.
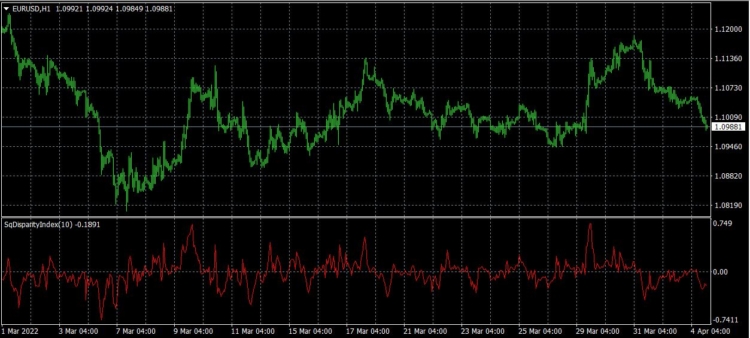
The indicator has one line:
- Disparity index
We have added these basic conditions:
- Disparity Index is rising/falling
- Disparity Index is above/below level
- Disparity Index crosses above/below level
Indicator is implemented for: MT4/MT5/Tradestation/ Multicharts
You can download the indicator and conditions here
Relative Vigor Index – RVI
The Relative Vigor Index (RVI) is a momentum indicator used in technical analysis. It measures the strength of a trend by comparing the closing price of a security with its trading range and smoothing the results using a simple moving average (SMA).
The RVI is interpreted in the same way as many other oscillators, such as the Moving Average Convergence-Divergence (MACD) or the Relative Strength Index (RSI). While oscillators tend to fluctuate between fixed levels, they can remain at extreme levels for extended periods, so interpretation must be done in a broad context to be actionable.
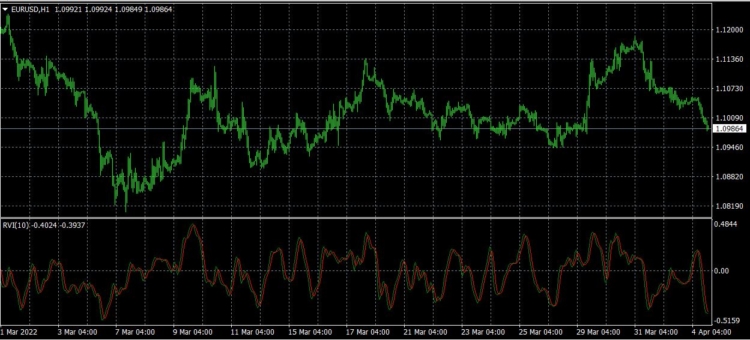
The indicator has one line:
- RVI
- RVI Signal
We have added these basic conditions:
- RVI is rising/falling
- RVI is above/below level
- RVI crosses above/below level
Indicator is implemented for: MT4/MT5/Tradestation/ Multicharts
You can download the indicator and conditions here
Double Smoothed Stochastic Bressert
Double Smoothed Stochastics – DSS Bressert is an oscillator introduced by William Blau and Walter Bressert shortly after each other in two slightly different versions. The calculation of DSS Bressert values is similar to the stochastic indicator. The difference is the use of double exponential smoothing. The advantages over the classic stochastic oscillators are the fast response to price changes in a still very smooth pattern. In addition, the extreme zones at the other end of the scale are reached quite frequently, even in strong trends, resulting in many trends confirming signals. Double Smoothed Stochastics – DSS The Bressert values are the same as the stochastics – values above 80 indicate an overbought condition of the market, and values below 20 indicate an oversold condition of the market.
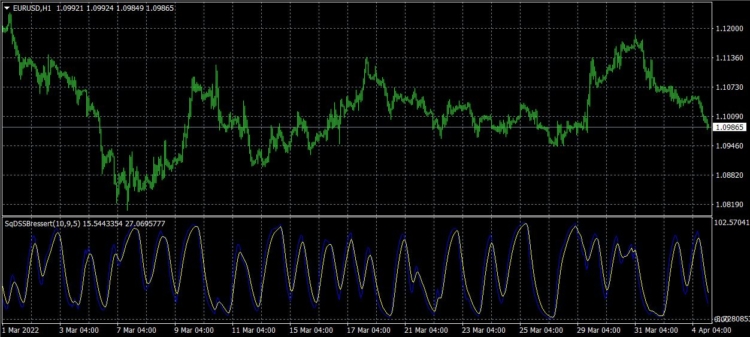
The indicator has two lines:
- DSS
- DSS Signal
We have added these conditions:
- DSS is crossing UP/Down
- DSS is rising/falling
Indicator is implemented for: MT4/MT5/Tradestation/ Multicharts
You can download the indicator and conditions here
You can easily create your conditions in Custom blocks. You can find more information here:
How to import custom indicators to SQX:


 Ellie Souckova

Excellent !!!! Thank you
thanks for the work
Hi,
thanks for the new indicators. I have already tried out RVI. However SQX generated EA with RVI indicator with strange (for me) parameters.
The entry condition in Algowizard looks like this: “4.0 crosses above RVI(63)[3]”
or another: “-24.0 crosses below RVI(128)[1]”
What I know the RVI output values are within +/-1. How shall I read this these values (4.0, -24.0)?
Thank you
Hey can you please be more specific? I dont have these issues in conditions.
May I send you this strategy? E-mail, or…? You can check it directly.
Please add new indicator like deeplearning that learns from past candles and predicts future by this way we can trade better.
Also we need some options for prop firms for example max loss for everyday and avoid news trading….
Hi there. As I opened a discussion in forum and till now I haven’t found some possible solution, I also write here if author of topic or someone else would like to give me some help. I recently downloaded and installed these new indicators Rate Of Change – ROC, Disparity Index – DI, Relative Vigor Index – RVI and Double Smoothed Stochastic Bressert to SQX platform and already compiled some strategies based on them. When I copied and upload these strategies on charts, I receive error messages in experts tab of MT4 like this “cannot open file ‘C:\Users\Administrator\AppData\Roaming\MetaQuotes\Terminal\83C78C4776458DB9D307B4F674BF2780\MQL4\indicators\SqDisparityIndex.ex4’ [2]” obviously… Read more »
Hi,
if you can please send us a sample strategy to support@Kevin.com, we will check
Thank you Tomas. I already have sent email with sample strategies