Part 1: Complexity and Number of Trades
About a year and a half ago, I came to the conclusion that the edge of my strategy development workflow was shrinking. . In 2014-15, making 40-55% per year on FX was a no-brainer. In 2016-2017, it became increasingly difficult to make profits with the standard workflow. Therefore, I decided to examine and analyze some paradigms of some procedures in statistical detail.
So we generated about 1.2 million strategies using only basic filters like a minimum number of trades and Stability SQ3 > 0.6. We used the largest possible data sample for the period 1987-2017 IS + OS and for the period 2017-2020. ( WFOS )
As True Out-of-sample (WFOS ) we used the period 2019-2020 – two years. During this period we observed the effects of selection, robustness tests, and other analyses.
We developed strategies for a 1-hour time frame and a 4-hour time frame, we used the Darwinex fee structure and had 1 pip slippage in each market.
The goal was to explore:
which factors in strategy selection influence True-Out-of-sample performance ( WFOS )
How basic robustness tests work
- complexity vs True Out-of-sample ( WFOS) performance
- the effect of the number of trades on strategy performance
- spread analysis vs True Out-of-sample (WFOS) performance
How it works
- Monte Carlo filtering
- SPP
- Multimarket testing
In designing the analysis, I drew inspiration from interviews with Better System traders and also from several other interviews with various hedge fund managers, and of course from the robustness testing tools available in StrategyQuant X.
I used Python tool, at least the Pandas library, and worked with the Jupyter Notebook IDE.
To generate such a large set of strategies required 3 Strong PCs with about 150 cores in total. The generation itself took a month and another month and a half for preparation and testing. We had two people working on it. The initial form of analysis was manual testing of factors in Python, later I used machine learning methods to validate my results.
We have generated the following honors in these markets:
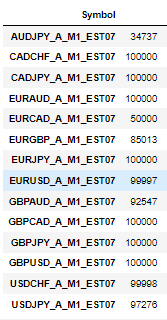
Edit: Added Additional informtions:
- In builder whe enabled all possible exit types except Exit Rule. We have also enabled Exit On Friday to avoid weekend gaps.
- Only used Entry type of our strategies was Enter at stop
Complexity
I was initially interested in complexity. If we consider the strategy as a model obtained by data mining, we can use the machine learning paradigm and various other sources about how the complexity of the model affects out-of-sample performance. In our case, we can assume that the complexity of the strategy obtained through data mining has an impact on the performance of the strategy in its True Out-of-sample Performance (WFOS – a portion of the data that was never used in the development or selection of the strategy).
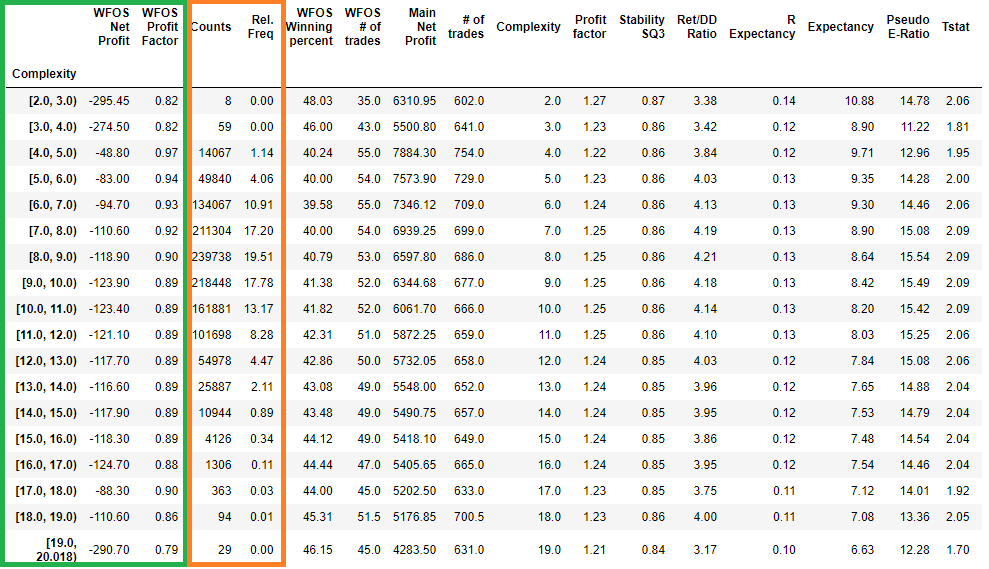
In the figure above, we see all the strategies bucketed by complexity and their effect on the median strategy in a given complexity interval ( Interval 2-3 means all strategies with complexity 2, etc. ).
- WFOS Median Net Profit
- WFOS Median Profit Factor
In the orange frame, we see two columns
- Rel. freq: relative frequency of strategies in a given interval ( bucket)
- Count: number of strategies in a given interval ( bucket)
Note that strategies with high complexity had lower median values for net profit and profit factor in WFOS (True Out-of-sample ). Conversely, strategies with higher complexity had worse median values.
Now let us look at the graphical representation of the above table
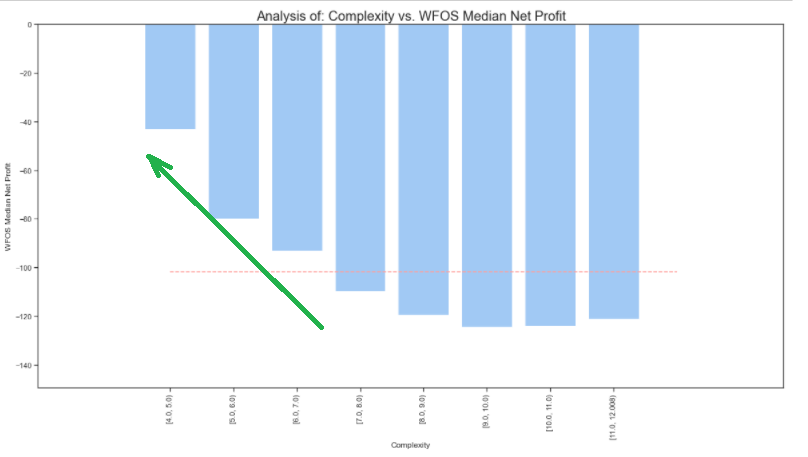
Complexity vs. WFOS Median Net profit
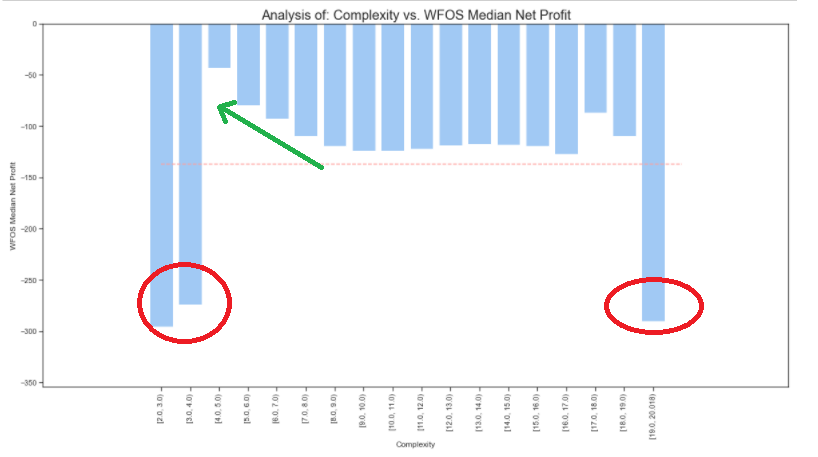
Note: The red line represents the average complexity value across the dataset
In the graph above, we see that strategies with complexity 2 and 3 achieved very poor True Out-of-sample median results. Unusually poor results were also achieved by the strategies with the highest complexity of 19. However, it is important to note that these are outliers – strategies that are very few in numbers.
Complexity vs. WFOS Profit Factor
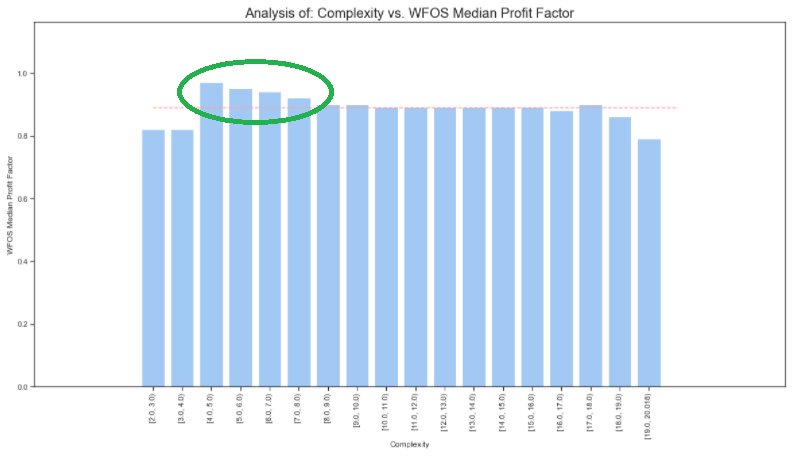
If we clean the dataset of outliers (I select only the values of complexity where the highest number of strategies is found), we see the above observations from the previous graphs even more clearly.
I only select strategies whose complexity is higher than 3 and lower than 13.
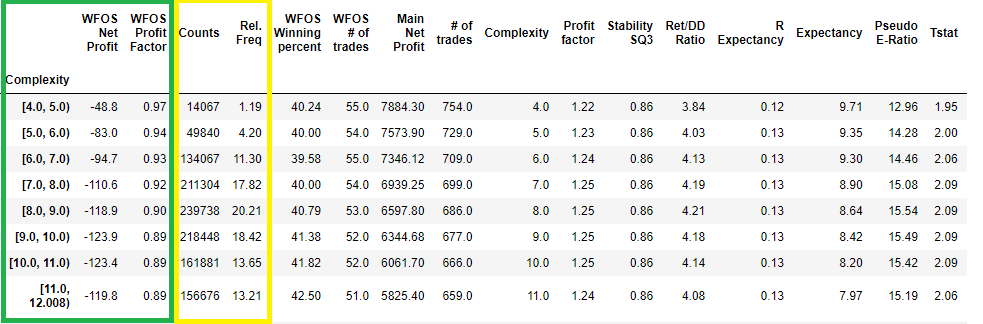
In the figure above, we see that the lower the complexity, the better the median values of net profit and profit factor (complexity 4, 5, 6 and median values in the green frame).
Let us take a look at the visual representation of the above table
The lower the complexity of the strategy, the better the result of the WFOS Median Net and the WFOS Median Profit Factor.
In the analysis, I also use inferential parametric and nonparametric Tests. The null hypothesis was formulated that there is no statistically significant difference between WFOS NP and PF with complexity 4,5,6 compared to strategies with complexity 7-13. The test results show that we can reject the null hypothesis and accept the alternative hypothesis. A large number of strategies significantly reduced the standard deviation and boosts the significance of the test.
Number of trades
In analyzing the number of trades, I assumed that the higher the number of trades ( the larger the sample of trades ), the more meaningful insights we get into the ultimate quality of the model. ( Strategies )
Which outcome of the strategy generated in SQX is more credible? The one that generates 10 trades in 10 years or the one that makes 1000 trades in 10 years?
Let us look at a basic analysis of our data set:
Distribution of strategies according to the number of trades in the whole backtest
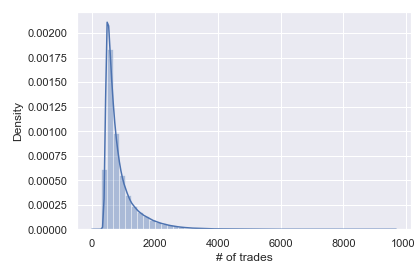
Distribution of strategies by several trades binned into deciles
We can see the basic characteristics of the Number Of Trades distribution. Note the 1st decile and the 10th decile. They represent the intervals 97-470 trades ( 1 decile ) and 1598 to 9575 trades. ( 10 decile)
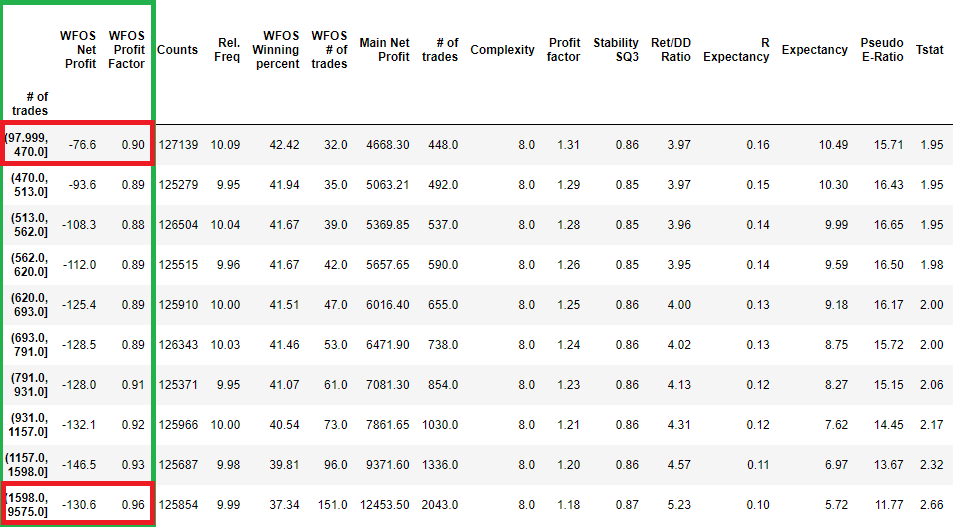
I will try to solve this problem by removing the outliers.
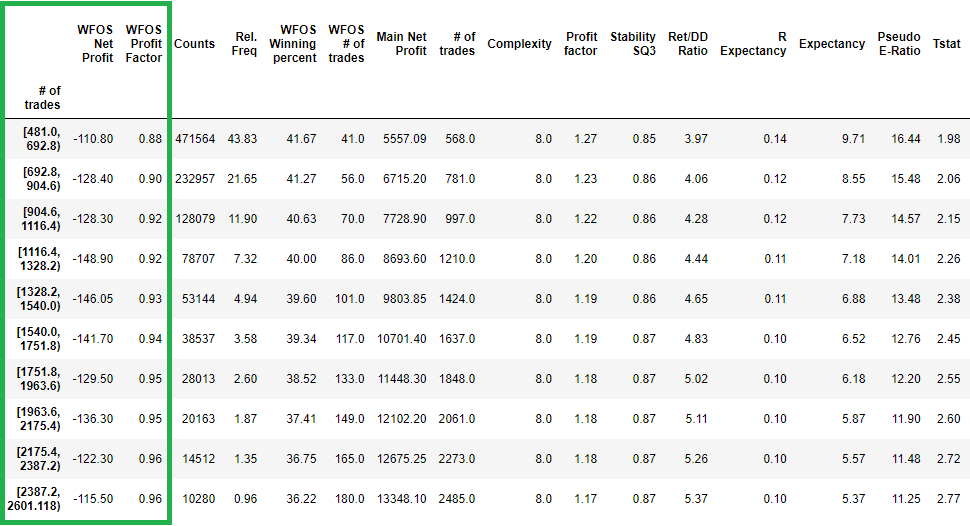
In the above figure, I see that even after cleaning the dataset, the increasing number of trades and hence statistical significance is not conducive to the performance of WFOS Median Net Profit a WFOS Profit Factor.
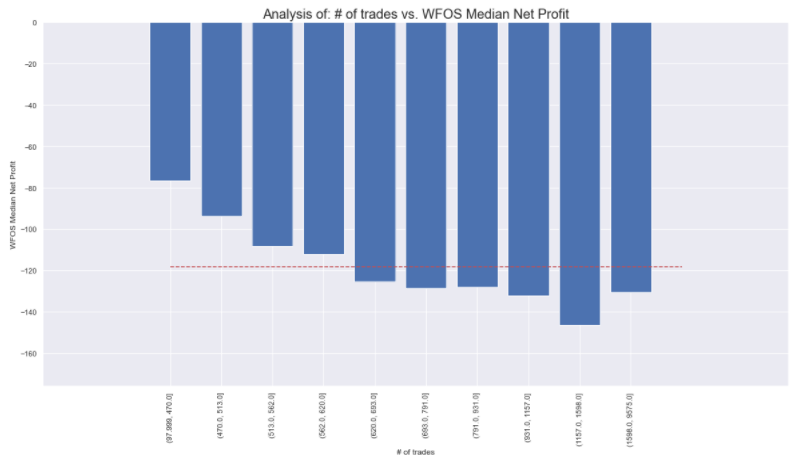
In the above graph, we can see that a higher number of trades does not lead to better WFOS Median Net Profit and WFOS Profit Factor results. In particular, please keep in mind that I am only making a selection. We do not select strategies based on other parameters.
On the contrary, the results show that fewer trades can mean better results in WFOS.
Complexity + NoT
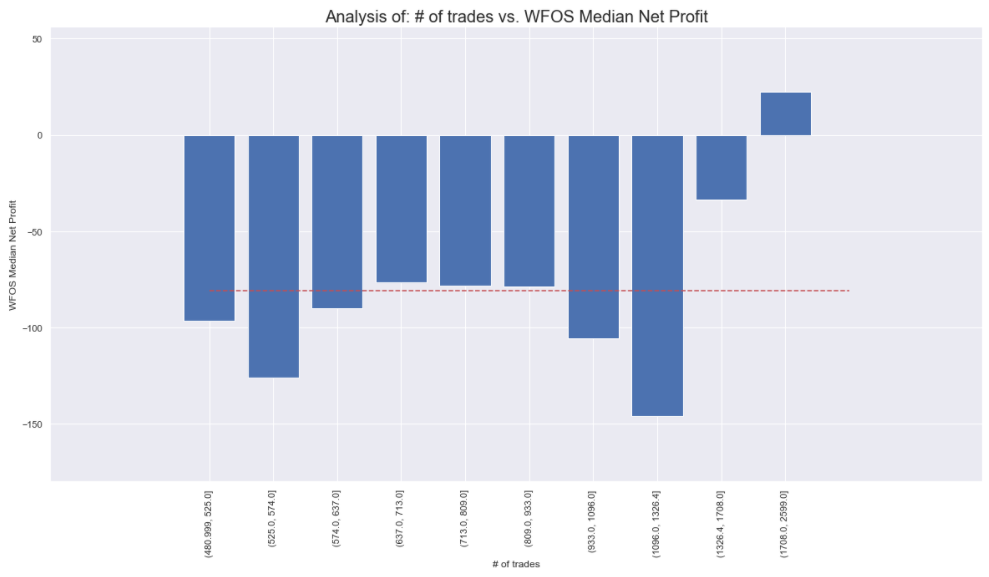
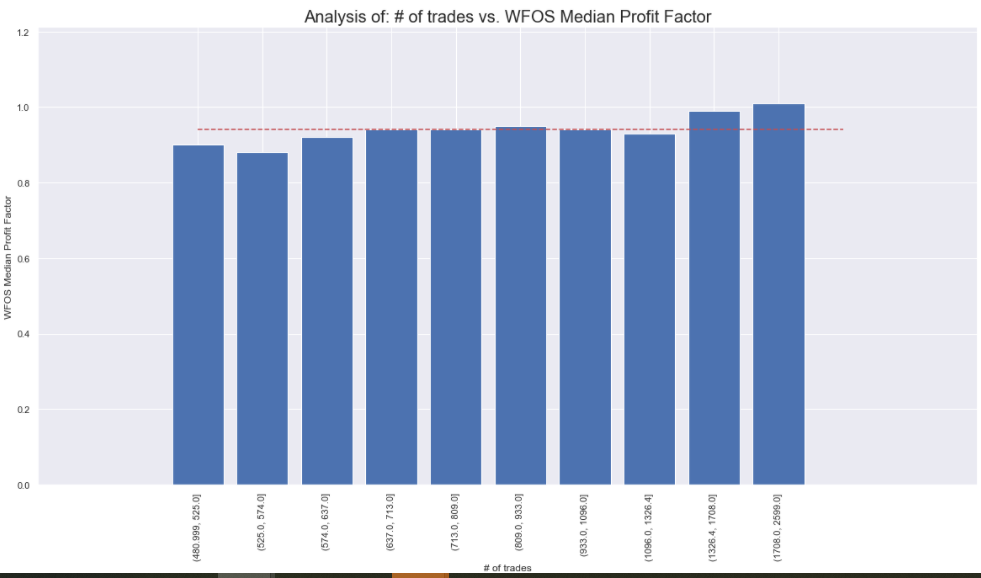
Let us try to combine the findings from the previous complexity analysis and select strategies with a complexity of 4 to 6 and several trades between 480 and 2600.
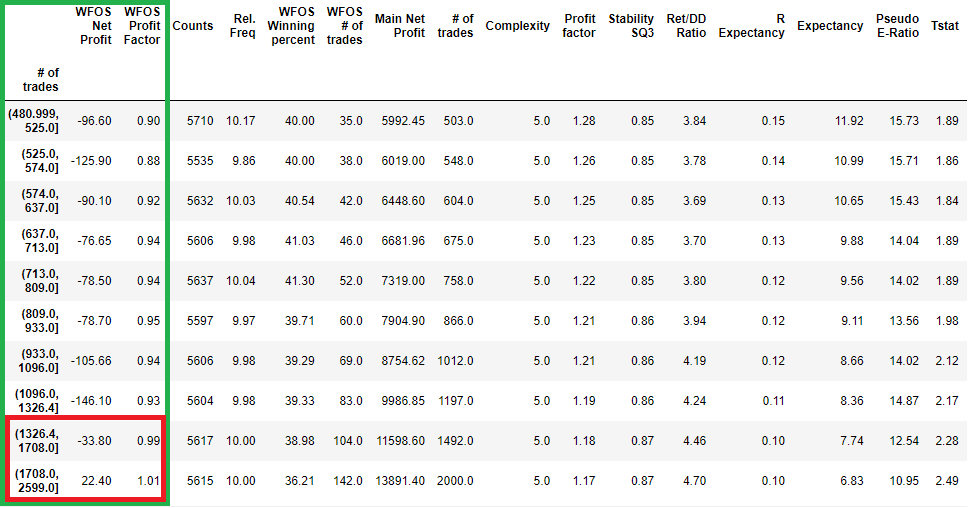
The change is noticeable. The combination of strategies with lower complexity and number of trades in the intervals 1326-1708 and 1708-2599 leads to significantly better results in WFOS Median Net Profit and WFOS Profit Factor.
Conclusion of the first part
It can be seen that the complexity in our dataset can affect the True Out-of-sample 1,2 strategies. The number of trades without combinations has no influence, but in combination with complexity, it is a strong factor. We remind you that this is the first part of a larger series.
The number of trades without combinations has no influence, but in combination with complexity it is a strong factor.
What does it mean exactly? That you should aim to build strategies that are as simple as possible while producing as many trades as possible..
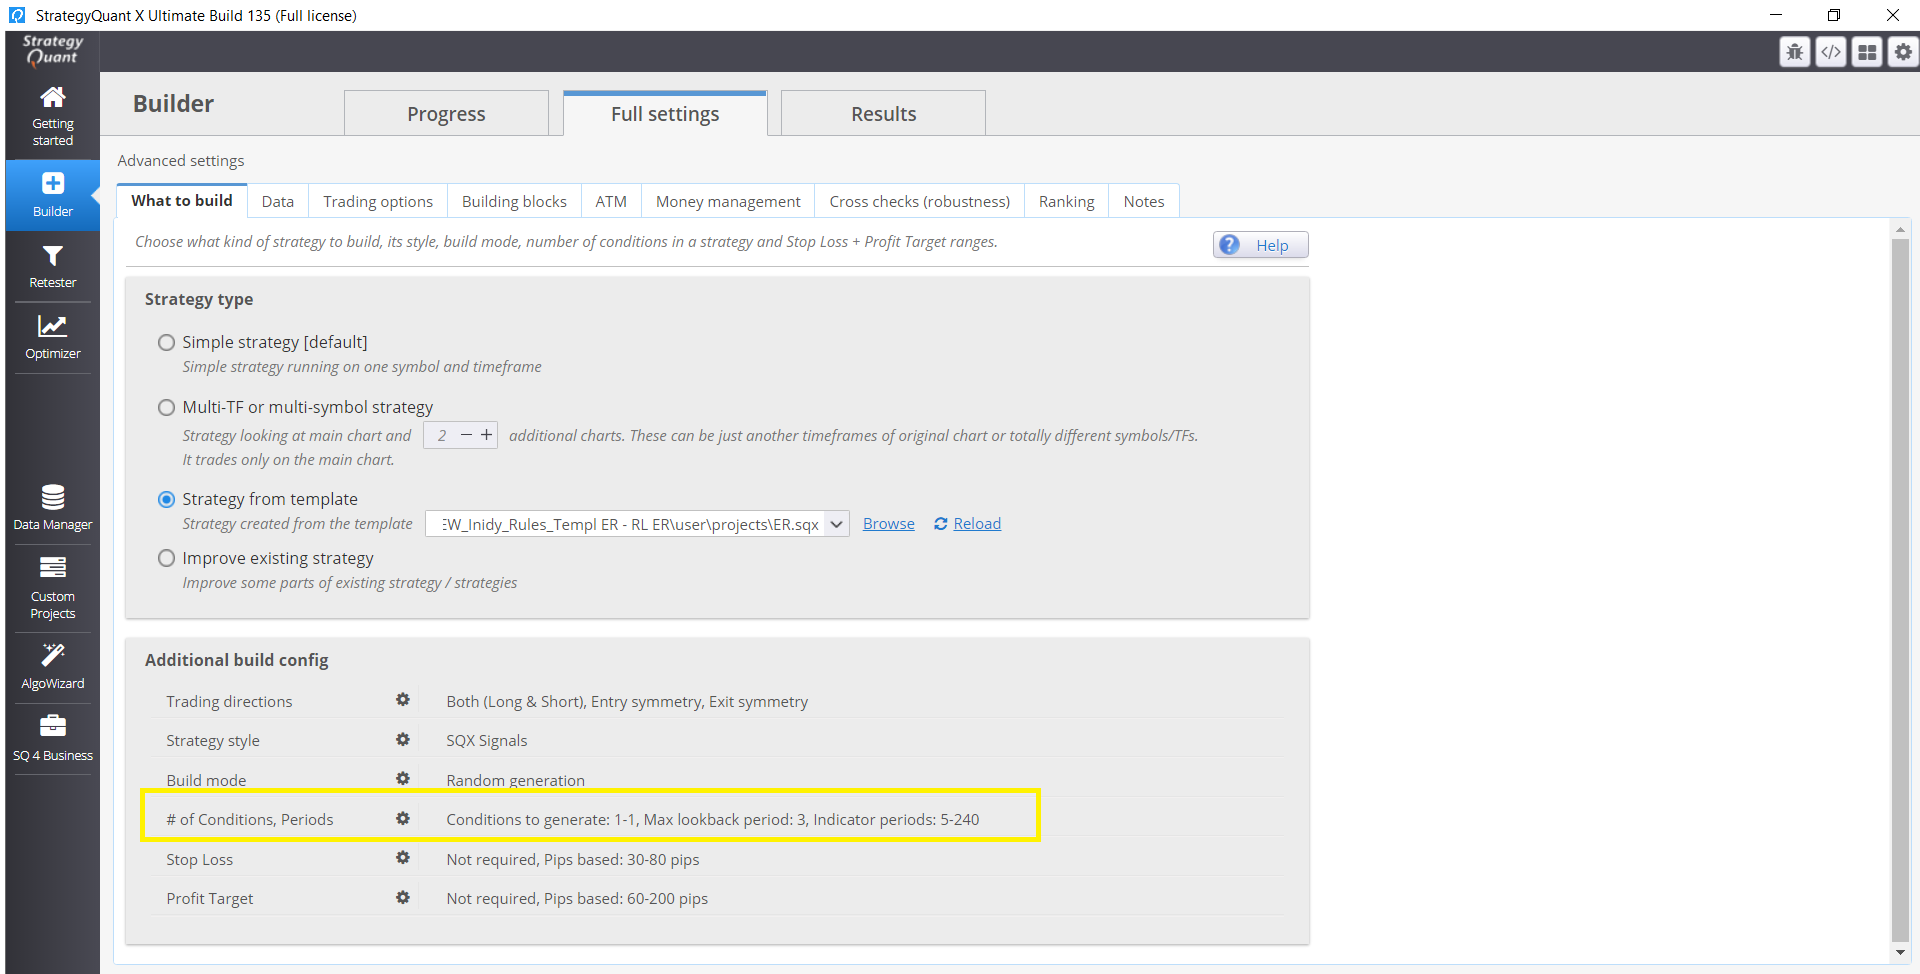
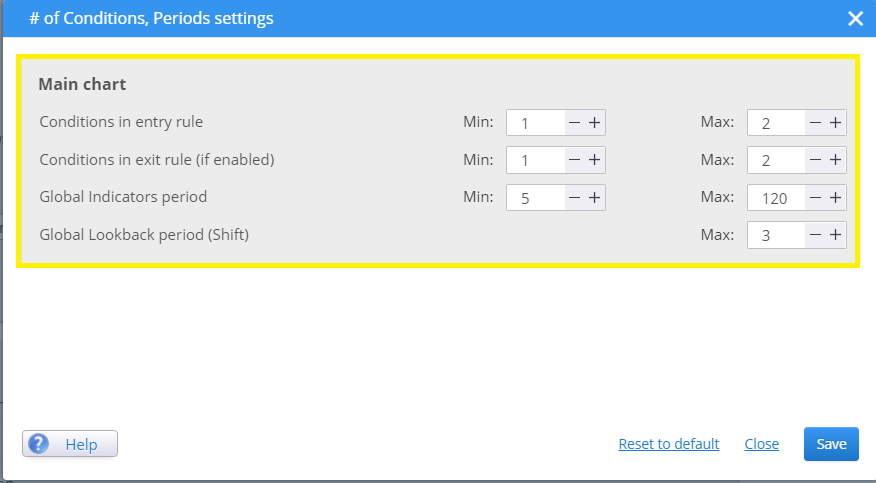
If you want to affect the complexity of your strategies in SQX you should keep the number of entry and exit rules low. I personally prefer Maximum Entry conditions set to 1-2.
Here you can specify the number of entry conditions that directly affect the complexity:
In the next episode next week, we will look at the robustness of the strategy to a higher spread. In the next episodes, we will go over the standard recommended metrics such as Profit Factor, Rer/ DD Ratio, and others. In the following episodes, we will take a look at the effectiveness of Monte Carlo tests and SPP.


 Tomas Vanek

Hi great analysis! im curious to know are the strategies analyzed symmetrical or just in one direction?
Hi. Strategies are symmetrical .
And both Long/Short direction.
More than 1300 trades on a single strategy, 1987-2017, is a lot !
it must take a long time to find this strategy
what is the difference between stability and SQ3 stability ? is sq3 stability better ?
Just slightly different formulas. You can check SQ CodeEditor to see the difference
Another interesting question would be : which indicator are the most robust ?
Some indicator may be confusing the system, which could explain why we must avoid complexity
Hey Emmanuel. Will post some research dedicated to this topic this year
Global look back period max of 3, maybe this bring complexity ?
One way to have less complexity, would be to have SQX working either long or short but not both way in the same strategy.
Robustness may be stronger, by carefully selecting the strategies with the most robust indicators as well
Clonex, I will follow your article very carefully ????
Your article is giving many idea !!!!
Thank you for your answer
Thank you very much Tomas for your answer !!!!
I will look in the codeeditor
You are doing an awesome job ???
Hey! i will do more analysis in upcoming weeks just give me more time pls 🙂
Can you please more elaborate this question? “This is not the main problem, because you only analyze the process parameters.”
According to the success of building automated trading strategies in my opinion to answer 3 questions: 1. Which market to choose? 2. How to use SQ? 3. Which broker to choose? which also represent 3 basic procedural steps. We can then divide each of these steps into further more detailed steps. For each process step, it is necessary to specify a parameter or parameters (some metric), which we will use to evaluate this process step. We then repeat and adjust the whole process over time to get satisfactory results. Therefore, if we analyze only part of the process, regardless of… Read more »
Lesser entry rules definitely resulted to higher trade counts and likewise, more entry rules (higher complex strategies) will have smaller trade counts. Therefore to expect higher complex strategies to have greater trade count is counter intuitive. So given a same data period, lesser rule strategies will have more trades than complex rule strategies. Eg a scapler strategies will trade more often than a swing strategy for a 1mth testing period. So trade counts is not a causation factor but rather a correlationship factor, lesser rules = higher trade count but that doesn’t mean higher trade count = better strategy. “The… Read more »
Hello Hannahis. thank you very much for your valuable comment. I will try to do the analysis in the next few days based on your ideas and will answer you here 😉
Thanks Ivan for your interesting article that offers valuable input for users to apply the implication of your findings. Will look forward to your update on the analysis on the quality of complex vs simple strategies based on same trade count.
Cheers,
Hannah
Hey ok, I will edit the post according to your questions and ideas.
Hi , Pre-Requisities: https://0bin.net/paste/9k-DXUYa#coabjzndNNXGf5f41j52xbfjehAqyNVxvaTNGnS4PW+ Strategies are biased with End of Friday (I’ll add this important info to the post). There is not such a “dramatic” difference in average number of trades per year between less and more complex strategies ( 20-22 vs 19 ). Avg Number in Trade is higher for less complex strategies than more complex strategies == No scalping strategies. ( probably less exits do the job . I will do the same analysis again in early 2022 and will analyze this too 🙂 ) There are no scalping strategies. TFs are 1 hour / 4 hours Entry… Read more »
Thanks Ivan for the extra insights and findings! Good point you brought up, whether complex strategies trade less because of it’s complex entry rules that restrict opening a trade or because of it’s exit rules that make the trade stay longer and hence less opening opportunities. Then we need to examine the duration of the trade, if complex rules have longer trade duration, it may therefore mean they trade less because of it’s exit rule and not so much because of it’s restrictive entry rules. Next we need to examine whether the complex rules are just duplicates of the same… Read more »
Hence we need to examine the characteristics of the simple vs complex strategies in order to know whether the software is truly generating complex strategies or just generating simple strategies with more rules (thus we think it is complex rules, but in reality it may be just a matter of more simple rules, redundant and ineffective filtering out of market noise). To truly quantify a complex strategy, the complex strategy must have the characteristics of what a complex strategy aim to do, i.e reduce potiental trade losses by cutting down trade counts/unwanted trade and therefore improve PF and thereby improve… Read more »
However if a user doesn’t care what kind of strategies they get but purely looking for robust strategies that generate the highest Net profit within the same duration of trading period, then I’m more inclined to believe that less rules make more robust strategies but one need to bear with the poor performance metric such as low pf and possible negative risk reward ratio. Because less complex strategies are more likely to be in sync with market conditions than complex strategies. There are higher chance of less complex strategies “fitting” or in sync with the market conditions than a complex… Read more »
I just started an experiment, just by changing the exit rules, I changed a strategy from a scalper into an intra day strategy. The purpose of this experiment is to 1) Test out which strategy’s opening rule is suited for which type of trading methodology, scalper vs intra day, 2) Test out which strategies are best suited for which currency pairs, which currencies are more volatile and hence more suited for scalper or intra day? 3) Which entry rule has higher entry accuracy, https://www.fxblue.com/users/hbs1ne/stats (scalper strategies) vs https://www.fxblue.com/users/hb82bene/stats These 2 portfolio deployed the same (open rules) strategies (template) but they… Read more »
Hi Hannahis ,