</> Codebase
StrategyQuant X platform codebase – a place to share coded customizations and extensions – among all users.
Columns > Databank / Filter
Return / Max Drawdown (Max Intraday Drawdown or Trade Drawdown)
This new code chooses the greater Drawdown (Max Intraday Drawdown or Trade Drawdown).
Columns > Databank / Filter
MAFE Profit Factor
Profit Factor which includes MAE and MFE as well as PL.
PF
MAE
MFE
column
stat
Timothy Masters
profit factor
Columns > Databank / Filter
Sortino Ratio
The Sortino ratio is a variation of the Sharpe ratio that differentiates harmful volatility from total overall volatility by using the asset's standard deviation of negative portfolio returns—downside deviation—instead of the total standard deviation of portfolio returns. The Sortino ratio takes an asset or portfolio's return and subtracts the risk-free rate, and then divides that amount by the asset's downside deviation. The ratio was named after Frank A. Sortino. Source: https://www.investopedia.com/ CREDIT: Acerbi
sortino ratio
risk
ratio
Columns > Databank / Filter
Avg. DD Pct. / Avg. Net Profit Pct. Ratio
Avg. DD Pct / Avg Net Profit Pct. Ratio
databank column
Indicators / Signals
Total Power Indicator – TPI
Total Power Indicator - TPI
indicator
oscillator
clonex
bulls
bears
Indicators / Signals
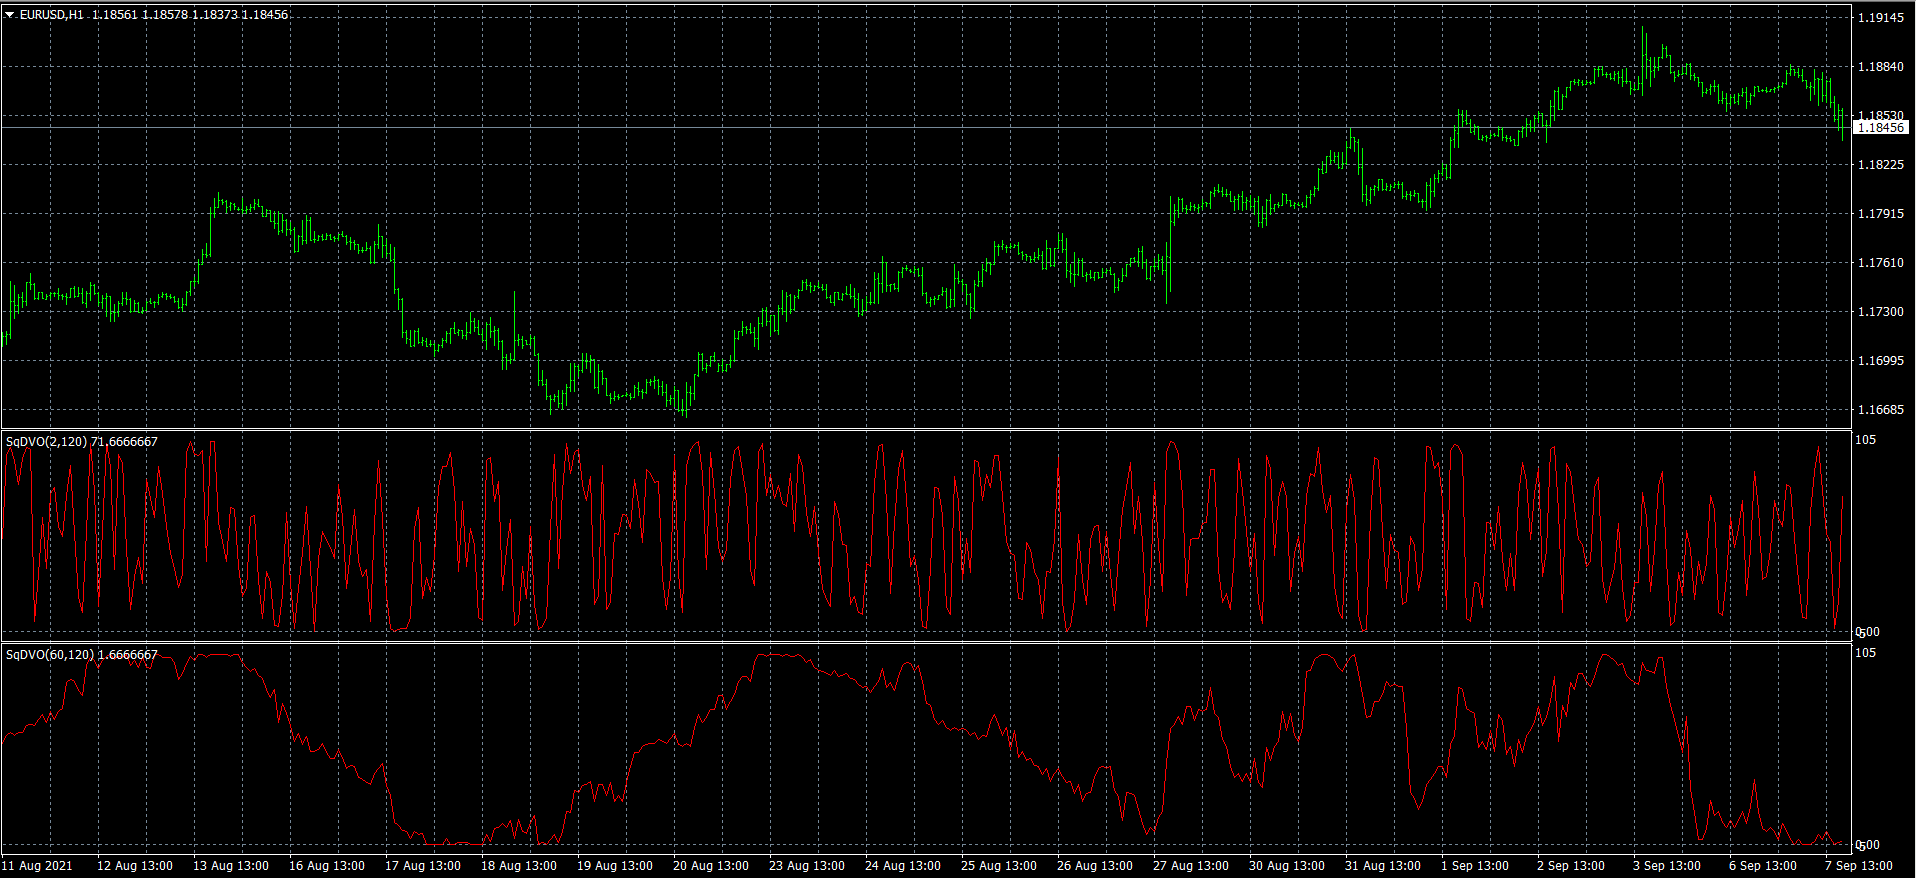
David Varadi Oscillator (DVO)
The Varadi Oscillator (VDO) is a leading indicator first proposed by David Varadi and originally aim to reduce the influence of the trend component in oscillators. The DVO can be described as a rolling percent rank of detrended prices over a certain lookback period. The detrending process used for the calculation of the indicator is based on the simple moving average of the ratio between the closing price and median ( hl2 ) price.
percentrank
oscillators
david varadi
DVO
Indicators / Signals
Kaufman Moving Average OHLC ( KAMA OHLC)
Kaufman Moving Average OHLC ( KAMA OHLC)
moving average
Indicators / Signals
Kaufman’s Efficiency Ratio (KER)
Currently implemented for MT4. Some uses for ER: - A qualifier for a trend following trade; a trend is considered "persistent" only when RE is above a certain value, e.g. 0.3 or 0.4 . - A filter to screen out choppy stocks/markets, where breakouts are frequently "fakeouts". - In an adaptive trading system, helping to determine whether to apply a trend following algorithm or a mean reversion algorithm. - It is used in the calculation of Kaufman's Adaptive Moving Average (KAMA).
trend
adaptive
kama
indicator