</> Codebase
StrategyQuant X platform codebase – a place to share coded customizations and extensions – among all users.
Indicators / Signals
Relative Vigor Index – RVI
Relative Vigor Index - RVI
oscillator
Relative Vigor Index - RVI
rvi
Columns > Databank / Filter
Walk Forward Optimisation Metrics
Snippets designed for better evaluation of WFO process. Idea behind this you can find in this series: Algorithmic Backtesting & Optimization for Alphas I will add blog post
wfo
optimisation
Columns
Entry Order Types
Databank snippets described here: https://strategyquant.com/blog/how-to-categorize-your-strategies-by-entry-type-quickly-and-efficiently/ How to import custom indicators to SQX: https://strategyquant.com/doc/programming-for-sq/import-export-custom-indicators-and-other-snippets/
stop
limit
Entry Order Types
orders
type
order types
market
Columns
Databank Ratios 01032022
AnnualPercReturnAvgDDPerRatio AvgWinPerc AvgWinPercAvgDDPerRatio NetProfitAvgDDRatio PercARAvgDDRatio
ratio
databank
columns
AnnualPercReturnAvgDDPerRatio
AvgWinPerc
What If scenarios (SQ)
What If: Evaluating the trading performance of strategies
Both snippets are described in this blog post: https://strategyquant.com/blog/evaluating-the-trading-performance-of-strategies/
trading
strategies
on/off
stop tradkng
Trading options
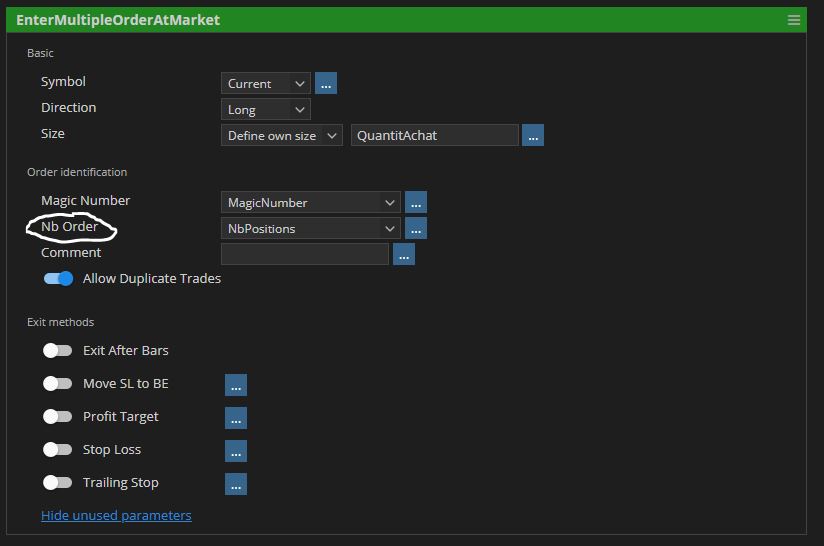
Multiple Market Order
Here is a Multiple Orders at Market snippets. It will send multiple orders at once with a different magic number.
AlgoWizard
Market Order
Multiple Market Order
Columns > Databank / Filter
Sortino Ratio
The Sortino ratio is a variation of the Sharpe ratio that differentiates harmful volatility from total overall volatility by using the asset's standard deviation of negative portfolio returns—downside deviation—instead of the total standard deviation of portfolio returns. The Sortino ratio takes an asset or portfolio's return and subtracts the risk-free rate, and then divides that amount by the asset's downside deviation. The ratio was named after Frank A. Sortino. Source: https://www.investopedia.com/ CREDIT: Acerbi
sortino ratio
risk
ratio
Indicators / Signals
Double Smoothed Stochastic Bressert
Double Smoothed Stochastics – DSS Bressert is an oscillator introduced by William Blau and Walter Bressert shortly after each other in two slightly different versions. The calculation of DSS Bressert values is similar to the stochastic indicator. The difference is the use of double exponential smoothing. The advantages over the classic stochastic oscillators are the fast response to price changes in a still very smooth pattern. In addition, the extreme zones at the other end of the scale are reached quite frequently, even in strong trends, resulting in many trend conforming signals. Double Smoothed Stochastics – DSS The Bressert values are the same as the stochastics – values above 80 indicate an overbought condition of the market, values below 20 indicate an oversold condition of the market.
oscillator
dss
inidcator
stochastic
clonex

Live coding sessions
Together with our worldwide community of traders, there is a growing group of programmers who are extending StrategyQuant with custom snippets and indicators. We would like to support your effort,