


 Spanish
 Portuguese
 French
 Italian
 German
 Japanese
Documentation & User Guides
Learn the basics, or refine your skills with tutorials designed to inspire.
Last updated on 23. 4. 2026 by Kornel Mazur
In-Sample / Out-of-Sample (IS vs. OOS) Testing
Page contents
In-Sample / Out-of-Sample (IS vs. OOS) Testing
In-Sample (IS) and Out-of-Sample (OOS) testing are foundational principles in the development, testing, and validation of trading strategies. StrategyQuant X incorporates IS/OOS segmentation and performance tracking to help users ensure their strategies are robust, unbiased, and not overfitted to historical in-sample data.
Definition of IS and OOS Data
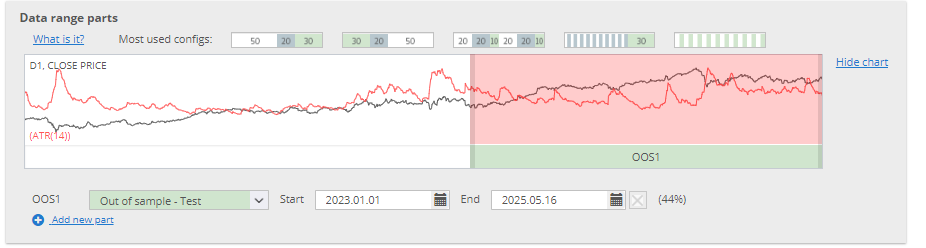
- In-Sample (IS) Data
- This portion of historical data is used during the development and optimization of the strategy.
- Strategy rules, parameters, and indicators are adjusted based on performance within this segment.
- Out-of-Sample (OOS) Data
- This is a reserved, unseen segment of data that is not used in development. It serves as a validation set to objectively test the strategy’s effectiveness and robustness.
Purpose of IS/OOS Testing
The primary goal is to detect overfitting and confirm the generalizability of a strategy:
- Ensures the strategy performs consistently on unseen data
- Provides a realistic expectation of live trading performance
- Helps confirm that performance is due to valid logic, not curve fitting
A strategy that performs well on both IS and OOS data is more likely to succeed in live trading and adapt to changing market conditions.
Benefits of IS/OOS Testing
- Robustness Assessment
- Verifies whether the strategy maintains consistent performance across both data segments
- Validation of Strategy Concepts
- Strong OOS results increase confidence that the trading idea is structurally sound
- Overfitting Prevention
- OOS testing helps highlight strategies that are overly optimized for the IS data
IS/OOS Implementation in StrategyQuant X
StrategyQuant X allows users to split historical data into IS and OOS segments via the Data Settings configuration. These segments are used across the Builder, Retester, and Optimizer modules.
- IS segment is used for strategy generation and optimization
- OOS segment is reserved for performance validation
- Performance metrics for both segments are tracked and compared automatically
OOS/IS Ratios
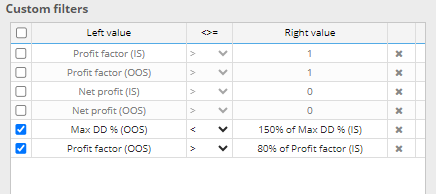
One of the key metrics used in StrategyQuant X to evaluate robustness is the OOS/IS ratio, which expresses the relative performance between the validation and development phases.
Interpretation:
- OOS/IS Ratio = OOS Metric ÷ IS Metric
- Example: OOS Net Profit / IS Net Profit
- A ratio close to 1.0 indicates consistent performance
- A significant drop in OOS compared to IS suggests deterioration, possibly due to:
- Overfitting
- Non-generalizable logic
- Market condition changes
Use in Robustness Evaluation:
- A good strategy will exhibit minimal deterioration across datasets
- StrategyQuant X allows integration of OOS/IS ratios into:
- Fitness criteria
- Custom filters
- Cross-check evaluations
Was this article helpful? The article was useful The article was not useful
Page contents