Displaying Text On A Chart
4 replies

Paul
10 years ago #111323
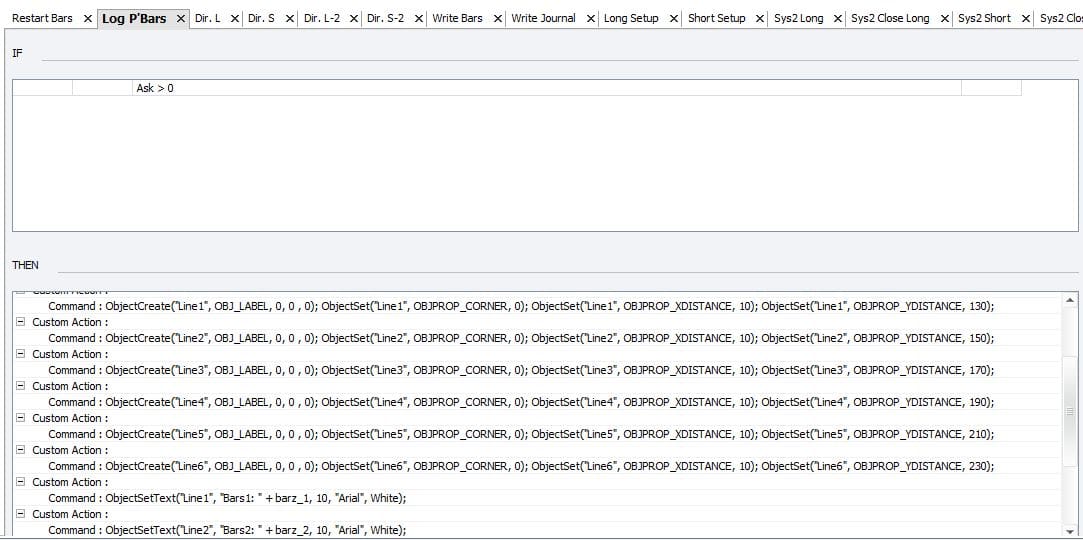
Here is some code to display up to 6 lines of text on a chart which is very handy for displaying variables when live testing EAs.
Copy and paste the ObjectCreate lines and corresponding ObjectSetText lines into the Command field of Custom Action.
For instance, if you only require 2 lines of text, copy and paste ObjectCreate(“Line1” and 2, and ObjectSetText(“Line1 and 2, resulting in 4 Custom Action commands.
Customise the following data in the ObjectSetText lines:
‘My Lable’ is a text lable for the data you wish to display.
‘my variable’ is the variable whose data you wish to display.
Be sure to leave the syntax of the rest of the lines exactly as shown.
The attached screen shot should make things clear.
Cheers,
Paul
ObjectCreate(“Line1”, OBJ_LABEL, 0, 0 , 0); ObjectSet(“Line1”, OBJPROP_CORNER, 0); ObjectSet(“Line1”, OBJPROP_XDISTANCE, 10); ObjectSet(“Line1”, OBJPROP_YDISTANCE, 130);
ObjectCreate(“Line2”, OBJ_LABEL, 0, 0 , 0); ObjectSet(“Line2”, OBJPROP_CORNER, 0); ObjectSet(“Line2”, OBJPROP_XDISTANCE, 10); ObjectSet(“Line2”, OBJPROP_YDISTANCE, 150);
ObjectCreate(“Line3”, OBJ_LABEL, 0, 0 , 0); ObjectSet(“Line3”, OBJPROP_CORNER, 0); ObjectSet(“Line3”, OBJPROP_XDISTANCE, 10); ObjectSet(“Line3”, OBJPROP_YDISTANCE, 170);
ObjectCreate(“Line4”, OBJ_LABEL, 0, 0 , 0); ObjectSet(“Line4”, OBJPROP_CORNER, 0); ObjectSet(“Line4”, OBJPROP_XDISTANCE, 10); ObjectSet(“Line4”, OBJPROP_YDISTANCE, 190);
ObjectCreate(“Line5”, OBJ_LABEL, 0, 0 , 0); ObjectSet(“Line5”, OBJPROP_CORNER, 0); ObjectSet(“Line5”, OBJPROP_XDISTANCE, 10); ObjectSet(“Line5”, OBJPROP_YDISTANCE, 210);
ObjectCreate(“Line6”, OBJ_LABEL, 0, 0 , 0); ObjectSet(“Line6”, OBJPROP_CORNER, 0); ObjectSet(“Line6”, OBJPROP_XDISTANCE, 10); ObjectSet(“Line6”, OBJPROP_YDISTANCE, 230);
ObjectSetText(“Line1”, “My Lable 1: ” + my variable 1, 10, “Arial”, White);
ObjectSetText(“Line2”, “My Lable 2: ” + my variable 2, 10, “Arial”, White);
ObjectSetText(“Line3”, “My Lable 3: ” + my variable 3, 10, “Arial”, White);
ObjectSetText(“Line4”, “My Lable 4: ” + my variable 4, 10, “Arial”, White);
ObjectSetText(“Line5”, “My Lable 5: ” + my variable 5, 10, “Arial”, White);
ObjectSetText(“Line6”, “My Lable 6: ” + my variable 6, 10, “Arial”, White);
 example.JPG
JS17
10 years ago #122023
Great post many thanks 🙂
Just a quick question if I may, your post says up to 6 lines, is 6 lines a limit within the programming langauge ?
Mark Fric
10 years ago #122090
no, there’s no limit in number of text objects you can display.
You just have to create more text objects using ObjectCreate() and then you can set their value using ObjectSetText()
Mark
StrategyQuant architect

Brian Caudill
5 years ago #234676
Here is an easy to add as many objects as you want to the chart
int n=8;//change this number to the number of objects you want to create
int distance_horizontal=10;//the horizontal location
int distance_between_verticle=40;//the distance between each object
int top_offset = 100; //how far from the top do you want to start printing the objects (if you dont want them right up against the top of the chart.
int text_color= clrAntiqueWhite; //the color that you want the text in the boxes to be
for(int i=0;i<n;i++){
ObjectCreate(“Line”+i, OBJ_LABEL, 0, 0 , 0);
ObjectSet(“Line”+i, OBJPROP_CORNER, 0);
ObjectSet(“Line”+i, OBJPROP_XDISTANCE, distance_horizontal);
ObjectSet(“Line”+i, OBJPROP_YDISTANCE, (distance_between_verticle * i)+ top_offset);
ObjectSetText(“Line”+i, “My Lable “+i, 10, “Arial”, White);
}

stickytrader
4 years ago #249063
Thanks for sharing this custom function . is there any solution to display text on chart for the back testing ? for example instead of drawing arrow on charts print “Buy Signal” on back test .
Viewing 4 replies - 1 through 4 (of 4 total)