We have added several new indicators and snippets to the sharing server in recent months. In today’s blog post, we’ll briefly go through each of them.
Ehlers Hilber Transform – EHT
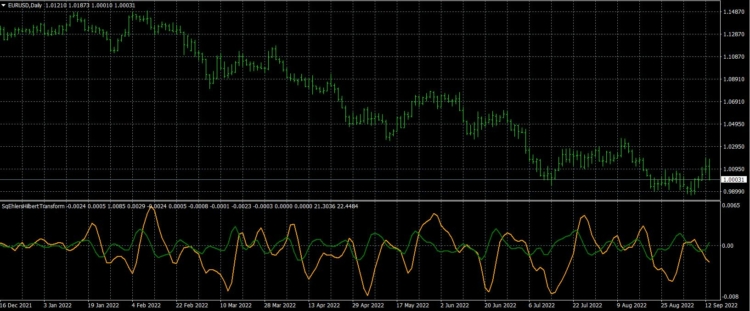
イーラーズ・ヒルベルト・トランスフォーム・インジケーターは、先駆者であるジョン・イーラーズによって開発されました。イーラーズ・ヒルベルト・トランスフォームは、デジタル信号処理で使用されるオールパスフィルターです。現在と過去の価格差およびいくつかのフィードバックを使用して、価格値は実数部(同相)と虚数部(直交)の複素数成分に分解されます。ユーザーは入力(平均)と期間の長さを変更できます。.
このインジケーターは主にエーラーズのモーザー・オブ・オール・ムービング・アベレージ(MOAMA)の計算に使用されます。.
インジケーターには2本の線があります:
- インフェーズ
- 直交
これらの条件を追加しました。 カスタムブロック:
- EHTCrossesUP/EHTCrossesDown
- EHT同相は直交の上下にあります
インジケーターは以下のプラットフォームに対応しています:MT4/MT5/Tradestation/ Multicharts。.
インジケーターと条件をダウンロードできます ここ.
Ehlers Mother of All Moving Averages – MOAMA
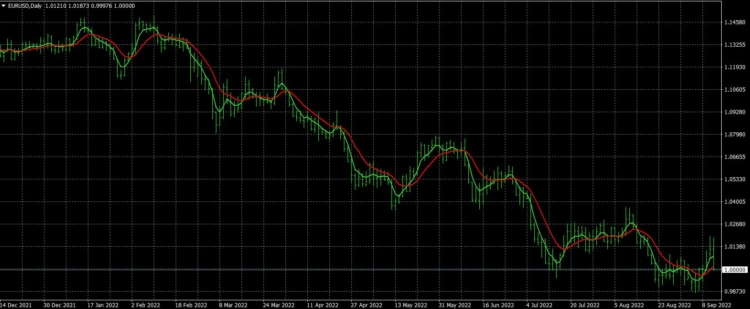
The Mother of Adaptive Moving Average (MAMA) adapts to price movement in an entirely new and unique way. The adaptation is based on the rate change of phase as measured by the Ehlers Hilbert Transform. The advantage of this method of adaptation is that it features a fast attack average and a slow decay average so that the composite average rapidly ratchets behind price changes and holds the average value until the next ratchet occurs.
インジケーターには2つのパラメータがあります:
- Fast Limit ( Alpha )
- Slow Limit (Beta )
The suggested maximum value is FastLimit = 0.5 and the suggested minimum is SlowLimit = 0.05. The variable alpha is computed as the FastLimit divided by the phase rate of change. Any time there is a negative phase rate of change the value of alpha is set to the FastLimit because the phase rate of change can be no less than 1. If the phase rate of change is large, the variable alpha is bounced.
More information about MAMA can be found ここ.
インジケーターには2本の線があります:
- MAMA
- FAMA
これらの条件を追加しました。 カスタムブロック:
- Close above/below MAMA
- MAMA crosses above/below FAMA
- MAMA and FAMA falling/rising
- MAMA is above/below MAMA
インジケーターは以下のプラットフォームに対応しています:MT4/MT5/Tradestation/ Multicharts。.
インジケーターと条件をダウンロードできます ここ.
Smoothed RSI – SRSI
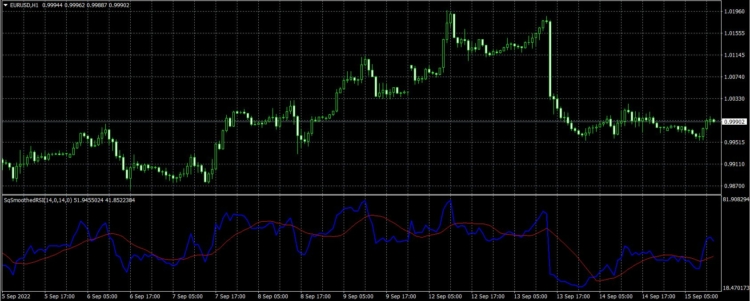
The Smoothed RSI indicator is a classic RSI indicator with a moving average applied to the RSI itself. This makes it possible to smooth the RSI curve, which could lead to a smaller number of signals, but it is also possible to generate RSI signals concerning its moving average.
The indicator has four parameters:
- RSI期間
- Input Price ( Computed From )
- Ma Type ( Type of moving average )
- MA Period
インジケーターには2本の線があります:
- RSI
- Moving Average of RSI
これらの条件を追加しました。 カスタムブロック:
- RSI crosses Up/Down its Moving Average
- RSI crosses Up/Down its Moving Average and RSI is above/below Level
- RSI crosses Up/Down its Moving Average and RSI MA is falling/rising
- RSI MA is falling/rising
インジケーターは以下のプラットフォームに対応しています:MT4/MT5/Tradestation/ Multicharts。.
インジケーターと条件をダウンロードできます ここ.
Hurst Exponent – HE

We can use the Hurst exponent (H) as a measure for long-term memory of a time series, that is, to measure the amount by which that series deviates from a random walk. The scalar represents the relative tendency of a time series either to regress strongly to the mean (mean-reverting pattern) or to cluster in a certain direction (trending pattern).
The values of the Hurst exponent range between 0 and 1. Based on the value of H, we can classify any time series into one of the three categories:
- If the Indicator value is below 0.5 then we can expect a mean-reverting (anti-persistent) series. The closer the value is to 0, the stronger the mean-reversion process is. In practice, it means that a high value is followed by a low value and vice-versa.
- If the Indicator value is 0.5 — a geometric random walk.
- If the Indicator value is above 0.5 — a trending (persistent) series. The closer the value is to 1, the stronger the trend. In practice, it means that a high value is followed by a higher one.
ソース https://towardsdatascience.com/introduction-to-the-hurst-exponent-with-code-in-python-4da0414ca52e
インジケーターには2つのパラメータがあります:
- Applied price
- ピリオド
インジケーターには1本の線があります:
- ハースト指数
これらの条件を追加しました。 カスタムブロック:
- Hurst Exponent is above/below Level
- Hurst Exponent is above/below 50
インジケーターは以下のプラットフォームに対応しています:MT4/MT5/Tradestation/ Multicharts。.
インジケーターと条件をダウンロードできます ここ.
Close Minus Moving Average – CMMA
Special thanks goes to the fellow user AgentPot who helped me with the creation of the indicator in SQX and in Metatrader4.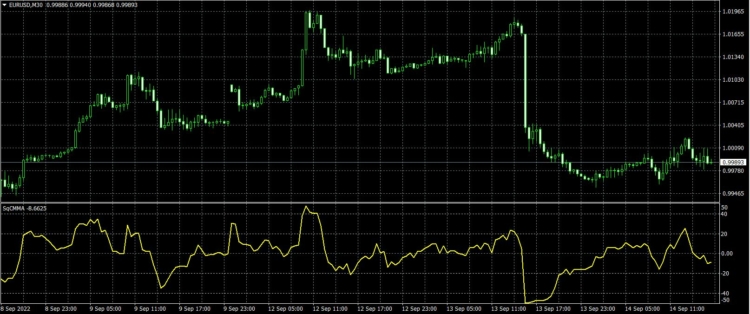
この指標のアイデアは、著書『Statistically Sound Indicator For Financial Market Prediction』の著者であるティモシー・マスターズ(Timothy Masters)によるものです。.
現在地を含まないルックバック期間中の対数終値の移動平均を単に計算し、それを現在の対数終値から引く。この指標の正規化は3つの要素で構成されている。最も重要な要素は、現在のバーを含むATRを用いた対数価格の実効レンジで除算されるものである。このスケーリングにより、ボラティリティの異なるレジームと市場の両方が補正される。2つ目の正規化は、1にルックバック期間を加えた値の平方根で除算することである。.
インジケーターには1本の線があります:
- CMMA
これらの条件を追加しました。 カスタムブロック:
- CMMAはレベルの上下に位置しています
- CMMAが上昇/下落している
- CMMAがレベルを上抜け/下抜けした
インジケーターは以下のプラットフォームに対応しています:MT4/MT5/Tradestation/ Multicharts。.
インジケーターと条件をダウンロードできます ここ.
Logarithmic Average True Range – LATR
Special thanks goes to the fellow user AgentPot who helped me with the creation of the indicator in SQX and in Metatrader4.
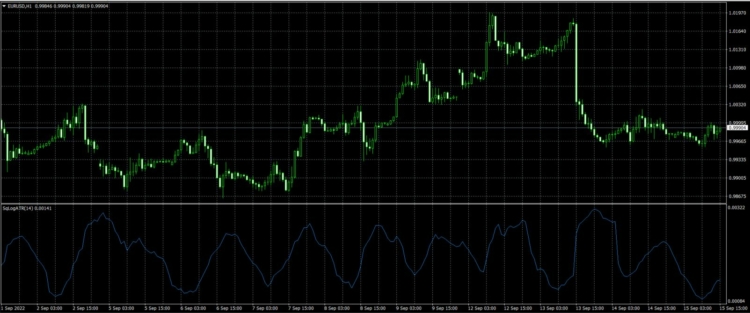
このインジケーターは、終値から移動平均を引いた値(CMMA)を計算するために使用されます。ATRとの違いは、価格が対数によって正規化されている点です。.
インジケーターには1本の線があります:
- LogATR
これらの条件を追加しました。 カスタムブロック:
インジケーターは以下のプラットフォームに対応しています:MT4/MT5/Tradestation/ Multicharts。.
インジケーターと条件をダウンロードできます ここ.
インポートの方法 カスタムブロック:
- SQXでアルゴウィザードを開く
- カスタマイズを選択
- カスタムブロックを選択
- カスタムブロックをインポート
- 彼らを救え
カスタムブロックを使えば、条件分岐を簡単に行うことができます。詳細はこちらをご覧ください:
このモジュールでは、カスタムブロックを変更することもできます。ピリオドの変更、ステップの変更などを行います。.
SQXにカスタムインジケーターをインポートする方法:



 英語
 スペイン語
 ポルトガル語
 フランス語
 イタリア語
 ドイツ語






excellent !!! , Thank you Ivan
ありがとう、,
But why you do not add them directly into SQX?
It’ll be better for use.