We have added several new indicators and snippets to the sharing server in recent months. In today’s blog post, we’ll briefly go through each of them.
Ehlers Hilber Transform – EHT
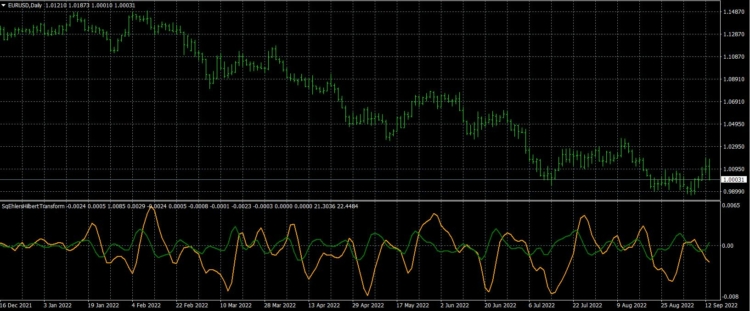
The Ehlers Hilbert Transform Indicator was developed by pioneer John Ehlers. Ehlers Hilbert Transform is an all-pass filter used in digital signal processing. Using current and past price differences and some feedback, the price values are decomposed into their complex number components of real (in-phase) and imaginary (quadrature) parts. The user can change the input (mean) and the period length.
This indicator is mainly used to calculate Ehler’s Mother of All Moving Averages – MOAMA.
The indicator has two lines:
- InPhase
- Quadrature
We have added these conditions as custom blocks:
- EHTCrossesUP/EHTCrossesDown
- EHT Inphase is above/below Quadrature
Indicator is implemented for: MT4/MT5/Tradestation/ Multicharts.
You can download the indicator and conditions here.
Ehlers Mother of All Moving Averages – MOAMA
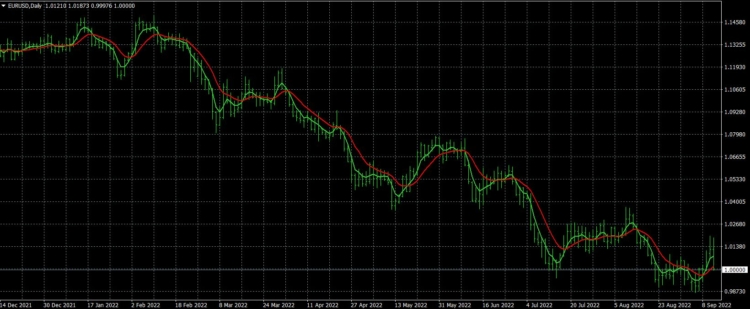
The Mother of Adaptive Moving Average (MAMA) adapts to price movement in an entirely new and unique way. The adaptation is based on the rate change of phase as measured by the Ehlers Hilbert Transform. The advantage of this method of adaptation is that it features a fast attack average and a slow decay average so that the composite average rapidly ratchets behind price changes and holds the average value until the next ratchet occurs.
The indicator has two parameters:
- Fast Limit ( Alpha )
- Slow Limit (Beta )
The suggested maximum value is FastLimit = 0.5 and the suggested minimum is SlowLimit = 0.05. The variable alpha is computed as the FastLimit divided by the phase rate of change. Any time there is a negative phase rate of change the value of alpha is set to the FastLimit because the phase rate of change can be no less than 1. If the phase rate of change is large, the variable alpha is bounced.
More information about MAMA can be found here.
The indicator has two lines:
- MAMA
- FAMA
We have added these conditions as custom blocks:
- Close above/below MAMA
- MAMA crosses above/below FAMA
- MAMA and FAMA falling/rising
- MAMA is above/below MAMA
Indicator is implemented for: MT4/MT5/Tradestation/ Multicharts.
You can download the indicator and conditions here.
Smoothed RSI – SRSI
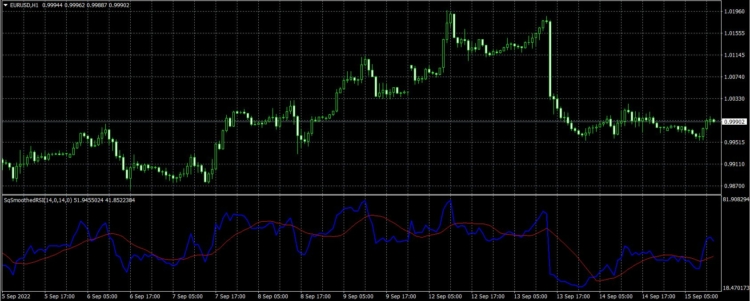
The Smoothed RSI indicator is a classic RSI indicator with a moving average applied to the RSI itself. This makes it possible to smooth the RSI curve, which could lead to a smaller number of signals, but it is also possible to generate RSI signals concerning its moving average.
The indicator has four parameters:
- RSI Period
- Input Price ( Computed From )
- Ma Type ( Type of moving average )
- MA Period
The indicator has two lines:
- RSI
- Moving Average of RSI
We have added these conditions as custom blocks:
- RSI crosses Up/Down its Moving Average
- RSI crosses Up/Down its Moving Average and RSI is above/below Level
- RSI crosses Up/Down its Moving Average and RSI MA is falling/rising
- RSI MA is falling/rising
Indicator is implemented for: MT4/MT5/Tradestation/ Multicharts.
You can download the indicator and conditions here.
Hurst Exponent – HE

We can use the Hurst exponent (H) as a measure for long-term memory of a time series, that is, to measure the amount by which that series deviates from a random walk. The scalar represents the relative tendency of a time series either to regress strongly to the mean (mean-reverting pattern) or to cluster in a certain direction (trending pattern).
The values of the Hurst exponent range between 0 and 1. Based on the value of H, we can classify any time series into one of the three categories:
- If the Indicator value is below 0.5 then we can expect a mean-reverting (anti-persistent) series. The closer the value is to 0, the stronger the mean-reversion process is. In practice, it means that a high value is followed by a low value and vice-versa.
- If the Indicator value is 0.5 — a geometric random walk.
- If the Indicator value is above 0.5 — a trending (persistent) series. The closer the value is to 1, the stronger the trend. In practice, it means that a high value is followed by a higher one.
Source: https://towardsdatascience.com/introduction-to-the-hurst-exponent-with-code-in-python-4da0414ca52e
The indicator has two parameters:
- Applied price
- Period
The indicator has one line:
- Hurst Exponent
We have added these conditions as custom blocks:
- Hurst Exponent is above/below Level
- Hurst Exponent is above/below 50
Indicator is implemented for: MT4/MT5/Tradestation/ Multicharts.
You can download the indicator and conditions here.
Close Minus Moving Average – CMMA
Special thanks goes to the fellow user AgentPot who helped me with the creation of the indicator in SQX and in Metatrader4.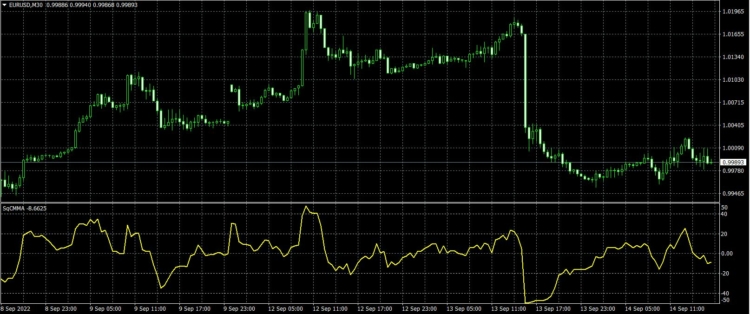
The idea for this indicator came from Timothy Masters, author of the book Statistically Sound Indicator For Financial Market Prediction.
We simply compute the moving average of log closing prices over a look-back period that does not include the current case and subtract it from the log value of the current closing price. The normalization of this indicator is composed of three components. The most important one is divided by the actual range of log prices with ATR, which includes the current bar. This scaling compensates for both regimes and markets with different inherent volatility. A second normalization is that we divide by the square root of one plus the lookback.
The indicator has one line:
- CMMA
We have added these conditions as custom blocks:
- CMMA is above/below Level
- CMMA is rising/falling
- CMMA crosses above/below Level
Indicator is implemented for: MT4/MT5/Tradestation/ Multicharts.
You can download the indicator and conditions here.
Logarithmic Average True Range – LATR
Special thanks goes to the fellow user AgentPot who helped me with the creation of the indicator in SQX and in Metatrader4.
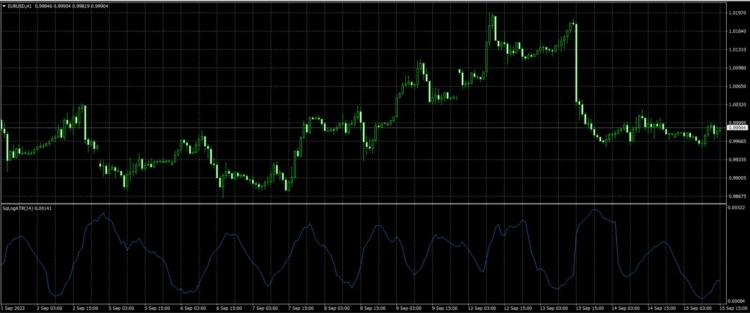
This indicator is used to calculate the Close Minus Moving Average – CMMA. The difference with the ATR is that the prices are normalized with the logarithm.
The indicator has one line:
- LogATR
We have added these conditions as custom blocks:
Indicator is implemented for: MT4/MT5/Tradestation/ Multicharts.
You can download the indicator and conditions here.
How to import custom blocks:
- Open the Algo Wizard in SQX
- Select Customize
- Select Custom Blocks
- Import Custom Blocks
- Save them
You can easily do your conditions in Custom blocks. More information you can find here:
In this module, you can also modify the custom blocks – change the periods, change the steps, etc.
How to import custom indicators to SQX:


 Ellie Souckova

excellent !!! , Thank you Ivan
Thanks,
But why you do not add them directly into SQX?
It’ll be better for use.