A common question of many traders who use StrategyQuant X is: How can I compare the quality of strategy entry signals? Which signal has a better edge and has a higher probability of success? In this article, I will show you how to use the new EDGE Ratio tool for evaluating the quality of trading signals. The Edge Ratio was first mentioned publicly in a very good book by Curtis Faith Way of the Turtle.
In the newest version of StrategyQuant X – build 131 we added the ability to work with the ATR(14) value in a moment of position opening. This value can be accessed via field order.ATROnOpen, which is a key feature for using the EDGE ratio tool.
What is the Edge Ratio?
The Edge Ratio is the MFE / MAE ratio normalized by the volatility of the instrument at the time of opening the position
Let us now explain the individual components from which the edge ratio is calculated:
Maximum adverse excursion (MAE) measures the maximum loss suffered by a single trade while it is open.
In contrast, Maximum favorable excursion (MFE) measures the maximum largest profit gained by a single trade while it is open.
ATR – Average true range measures the volatility of the instrument.
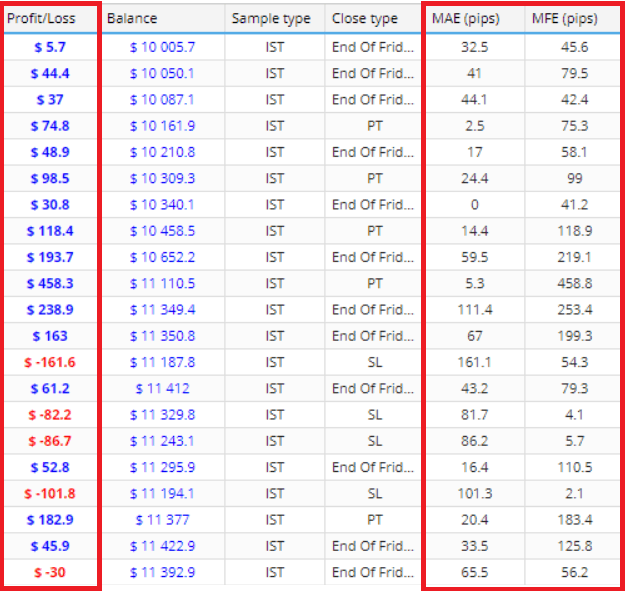
The picture above shows better the relationship between MAE / MFE and Profit/Loss.
The first row shows that position’s Profit/Loss was 5 .7 , while MAE – biggest drawdown during trade was 32.5 Pips. MFE’s largest observed profit during a trade was 45.6 Pips. So we can see that while the final profit from the position was moderate, the MFE was much bigger so the potential of trade was not satisfied.
Analysis of these ratios can help you discover if your exit methods are good enough. In the case of MAE, it can help you to know if your exits are good enough. More about these ratios you can read in this good article link.
Let’s go back to the edge ratio calculation itself. The Edge Ratio is calculated as follows
- Record MAE in pips and MFE in pips for each trade
- Divide Each of them by ATR(14) to adjust for volatility and normalize for future intermarket analysis
- Sum each value ( Normalized MAE and normalized MFE ) and divide with the total number of trades
- Edge ratio is the average volatility normalized MFE divided by average volatility normalized MAE
So the higher the MFE and simultaneously lower the MAE leads to the higher edge ratio. This means that the signal has a higher edge. ( The trade profit potential is higher than the loss potential ).
How can we use the edge ratio in StrategyQuant X?
Firstly, we can use the edge ratio as an indicator of strategy performance. We can work with the hypothesis that strategies with a higher edge ratio may be more resilient to possible changes in out-of-sample / Real Trading. However, this is a hypothesis that should be supported by extensive validation analyzes, ideally with several hundred thousand strategies tested over multiple periods.
In 2020, I conducted research on the sample of 1.2 million randomly generated strategies and attempted to identify features (Sharpe Ratio, Profit factor, etc. ) whose values may affect the true out-of-sample performance of a strategy. Basically, I tried to identify the ranking (Strategy Filtering Conditions) to select strategies for live trading. I used the Pseudo Edge ratio in my calculations MFE / MAE ratio and surprisingly the pseudo-edge ratio proved to be a good predictor of selecting high-quality strategies. However, this research is not yet completed therefore we will cover this topic in a future article.
The type of orders affects the results of the edge ratio. I primarily use market orders to measure the quality of the open-close signal, as Stop/Limit orders involve other factors/dimensions that affect the real value of the signal.
Other questions
At this point, other important factors should be considered. We know that StrategyQuant has a very efficient genetic engine builder, which is also constantly being improved.
However, we need to count that we can work with billions of combinations of strategy building blocks. The number of conditions and possibilities is called – degrees of freedom. From a machine learning and data science perspective, the higher the degrees of freedom, the greater the risk of overfitting the strategy, even if the strategy passes MC tests and other robustness tests.
This is not only a problem for us algo developers, but also scientists working in the field of evolutionary algorithms. In any case, overfitting during the development of strategies can lead to the failure of the strategy in real-time conditions and finally collapse of its edge.
It is the Edge ratio that can be a significant component of the bridge between purely genetic workflow development strategies and an IDEA FIRST development. A key role in this process is played by the Custom Blocks – SQX feature, available from version 127, which allows us to define our own parts of the strategy. I believe that the custom blocks are a real game-changer and an important part of the strategy-creating workflow in StrategyQuant.
You can define Regime filters, predefine breakout entry conditions and prepare your strategy design in a very sophisticated way. With a reasonable strategy design and a moderate genetic engine setup, in my opinion, it is possible to significantly eliminate the overfitting factor in strategy development from the perspective of strategy complexity and genetic engine builder setup complexity.
It should be noted that even during the whole idea first workflow it is extremely important to pay attention to the train/test/validate method of data partitioning.
StrategyQuantX is so flexible that there are several ways to analyze the edge ratio. There are complex workflows where you have to work with an external strategy analysis, extracting rules from xml to synchronize them with SQX, etc. and there are simpler options that can be used within the existing SQX workflow. In our analysis we will not use any external tools, all we need is included in StrategyQuant.
Improver incremental approach
For this approach, we will use custom blocks, templates, and incremental strategy development using SQX’s genetic engine. As the first step, we will use Edge ratio analysis for evaluating the quality of the signals and select those ones which have the highest potential.
Then, based on this analysis we will select the groups of blocks/strategies with the highest potential and use them in StrategyQuantX’s genetic development process. This way we will reduce the degrees of freedom and eliminate the possibility that SQX finds strategies that are too sensitive to noise.
1. Selecting basket of tested building blocks
In this step, we will select the basket of the building blocks which we will test in our analysis.
We can select building blocks that are already implemented in StrategyQuant or create your ones using custom building blocks functionality.
Here are several useful links where you can learn how to create your custom building block:
Do not forget one important thing. If you use custom blocks and examine both long and short signals at the same time then you have to set the opposite block for every custom block. Again we need to fully understand this functionality in SQX.
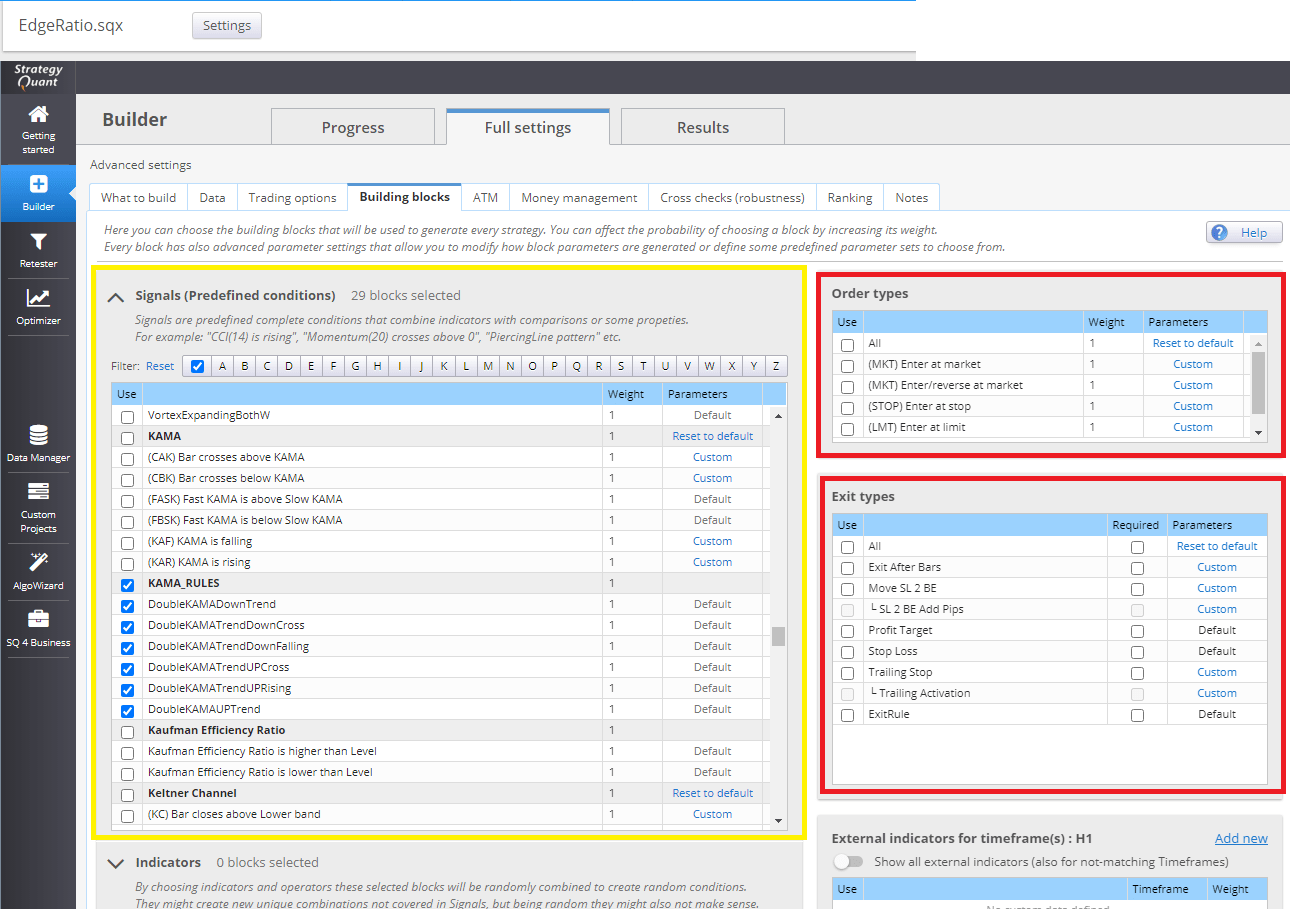
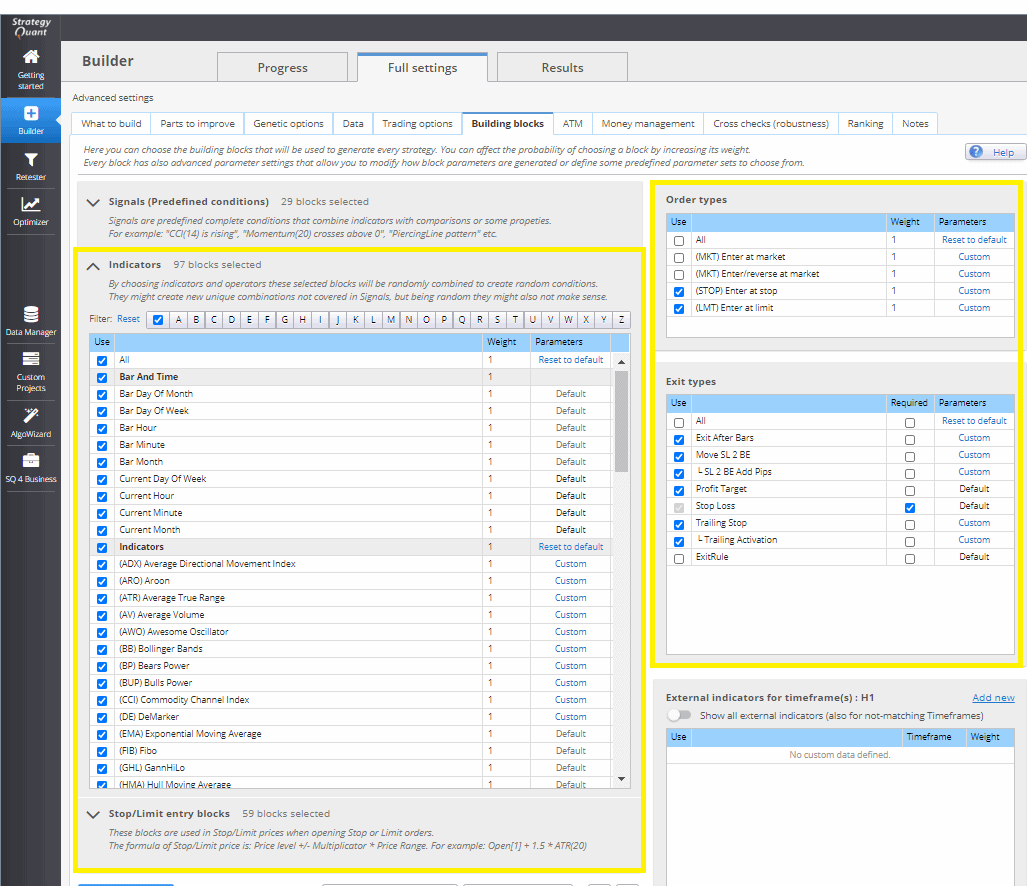
You can also use predefined blocks which are in Strategyquant X by default. Below, on the image, you can find selected building blocks that we will test in our analysis.
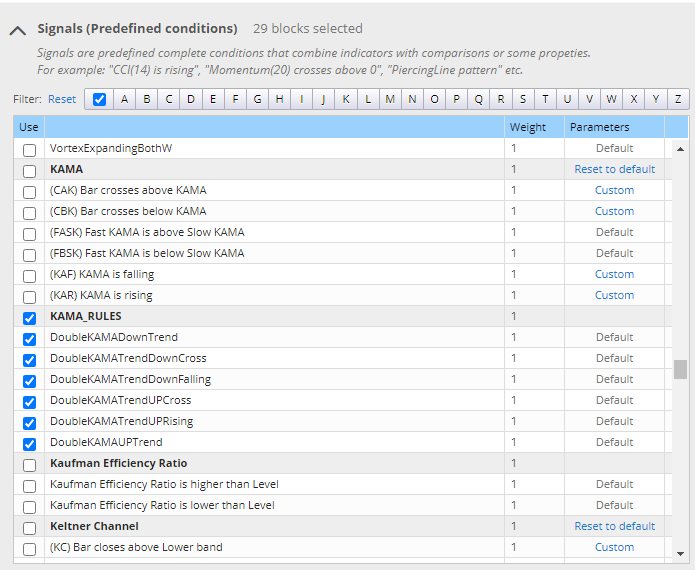
Selecting building blocks for our analysis
2. Creating a testing strategy template for performing analysis.
Strategy templates allow us to generate almost any kind of strategy in StrategyQuant. Before we will proceed to the creating strategy template for our analysis please check the detailed description of how templates work in our documentation here.
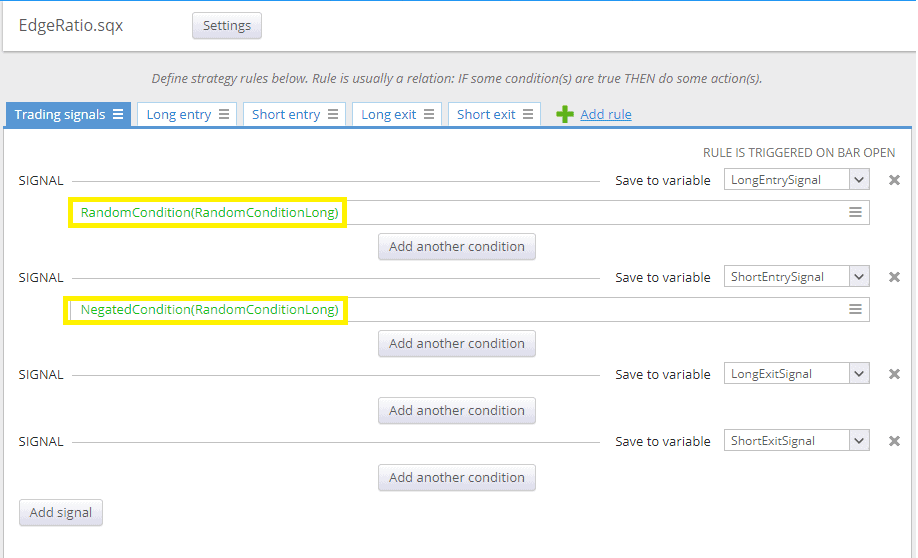
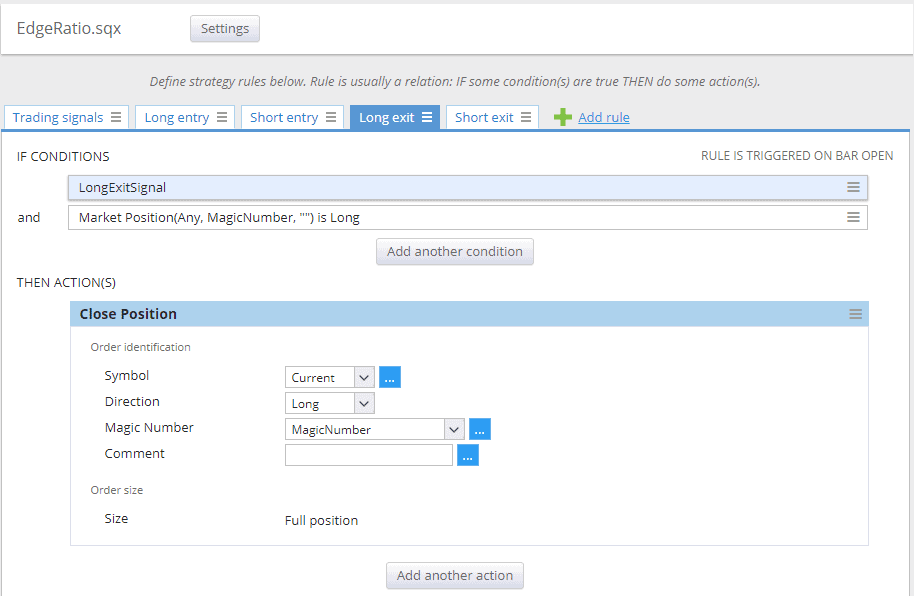
For our analysis we will create a template with the following structure: Strategy will be always in the market. It will enter a long trade whenever a long signal occurs. It will enter a Short trade whenever a signal opposite to the Long trade occurs.
In the picture below we can see how we set our entry and exit signals.
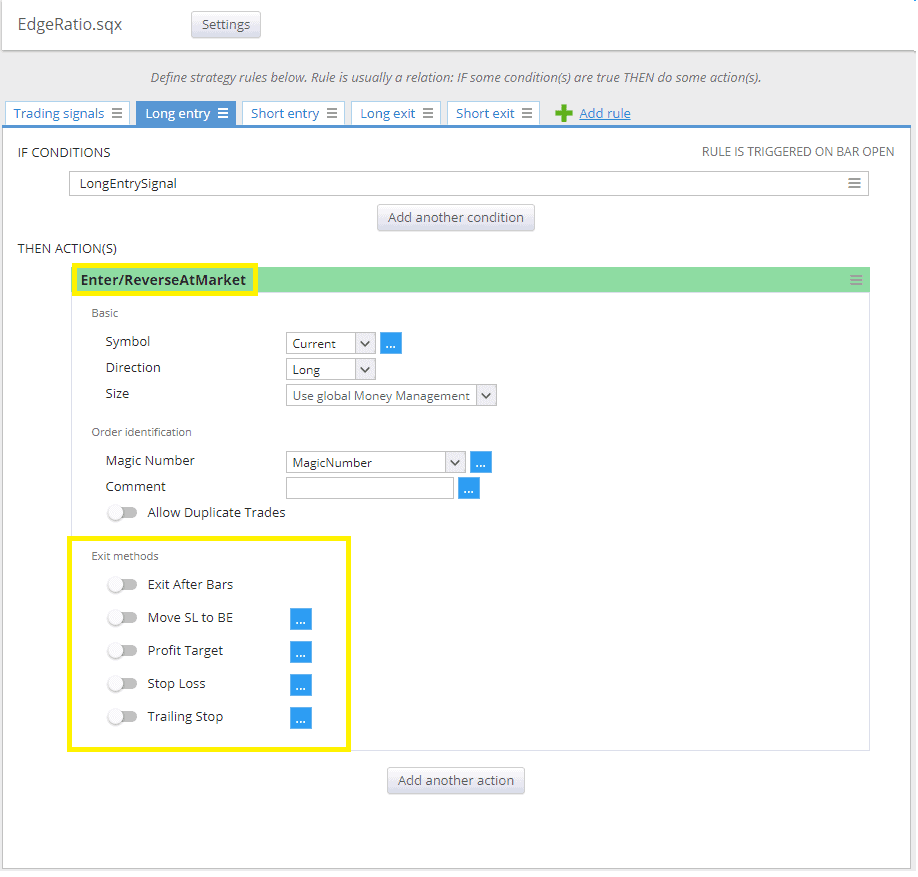
In the picture below we can see l not use any exit methods and we enter the Enter/Reverse At Market.
In the picture below we can see that the output logic is simple.
3. Setting Builder in StrategyQuant X
First, note that when the strategy template is used, some settings are overridden. In other words: What we set in the strategy template takes precedence over what we set in the builder.
We decide to generate from the template we created in the second step. We change the settings in the additional build configuration to reflect our intent:
- we will use random strategy generation
- we will use a maximum of one condition(signal) to generate.
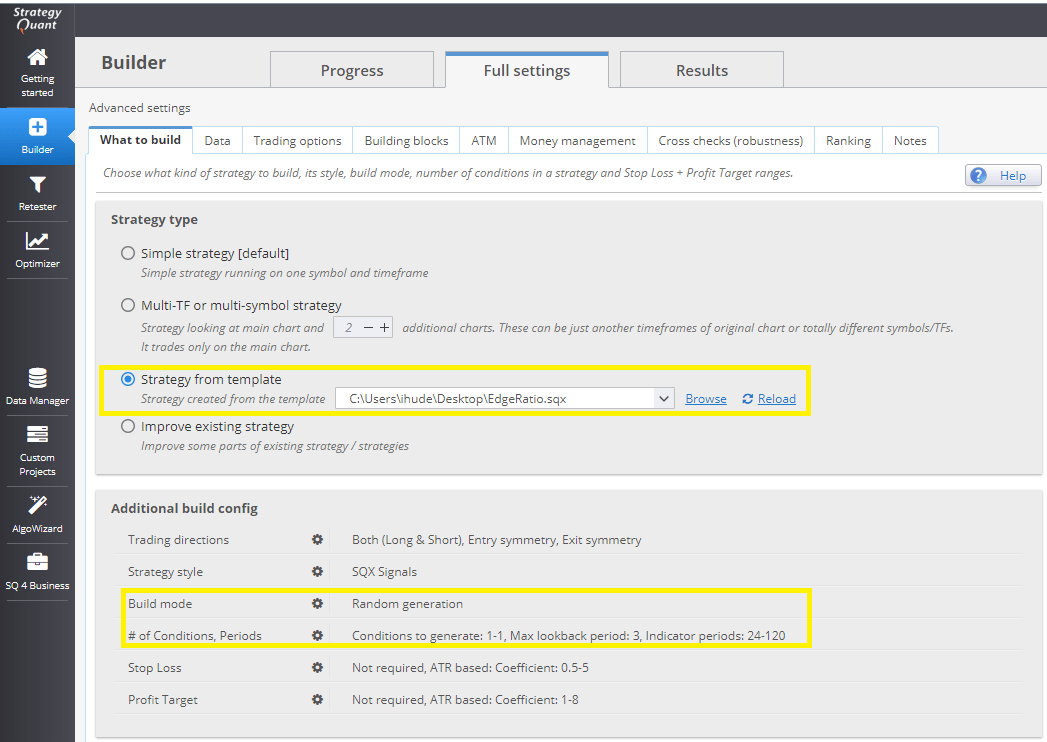
Blocks/conditions we choose from the list of blocks we want to analyze. We can choose the custom blocks we prepared in the first step.
We didn’t select any entry or exit method precisely because they are overridden in the strategy template.
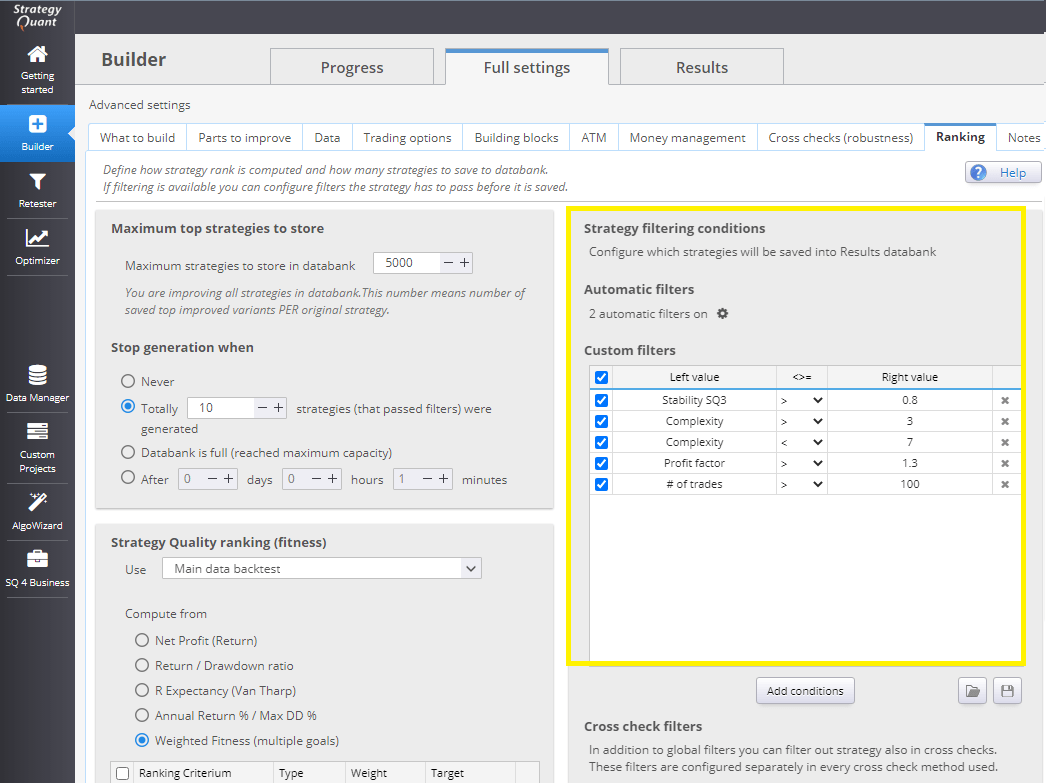
Another essential thing. It is important to set a minimum number of signals analyzed – in other words, the number of trades.
Analyzing edge ratio signals with a small number of trades is, in my opinion, statistical nonsense. Too high signals number will result in a low-profit factor for the strategy, and probably most of your profits will be eaten up by trading costs. On the other side – a low number of signals may be statistically insignificant.
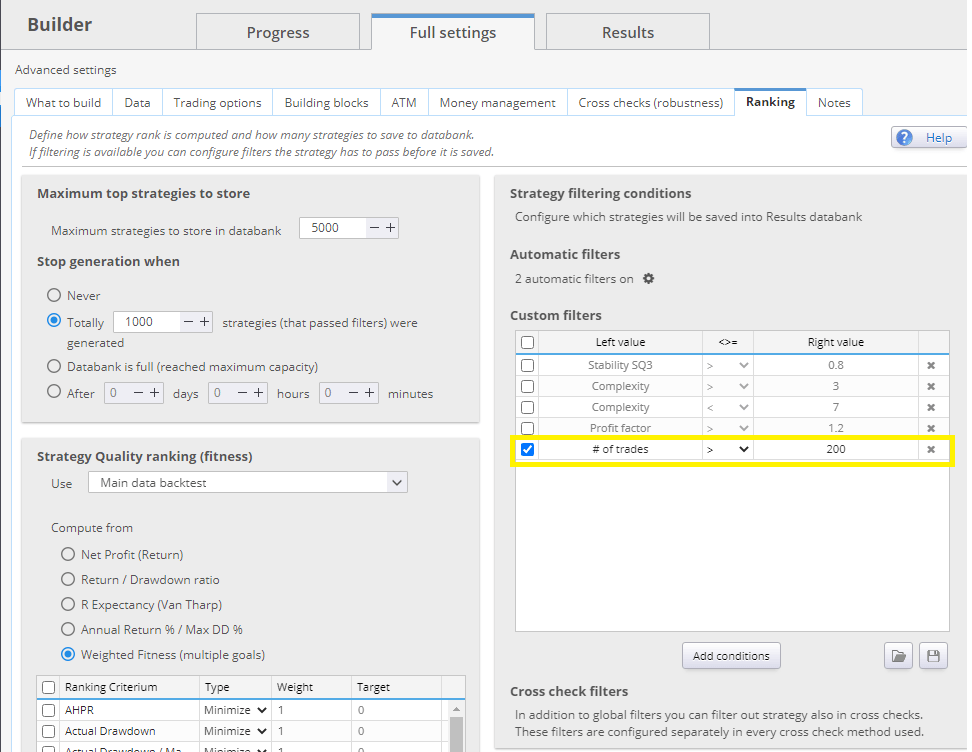
If we want to estimate the minimum number of trades statistically correctly, the Cochran’s Sample Size Formula can help us.
4. Strategies generation
After we have prepared all the settings, we can run the Builder in StrategyQuantX. We run the builder for a few hours to get a large sample of strategies with signals.
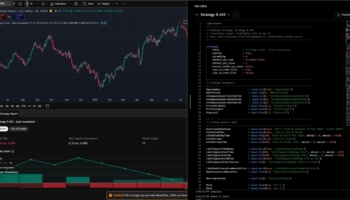
In the picture below, you can see our databank after a few hours. Note that we have strategies in the databank that ended in a loss – they have a negative Net Profit but have a high edge ratio. We don’t care about the outcome of the strategy. We care whether the signal has a positive edge ratio.
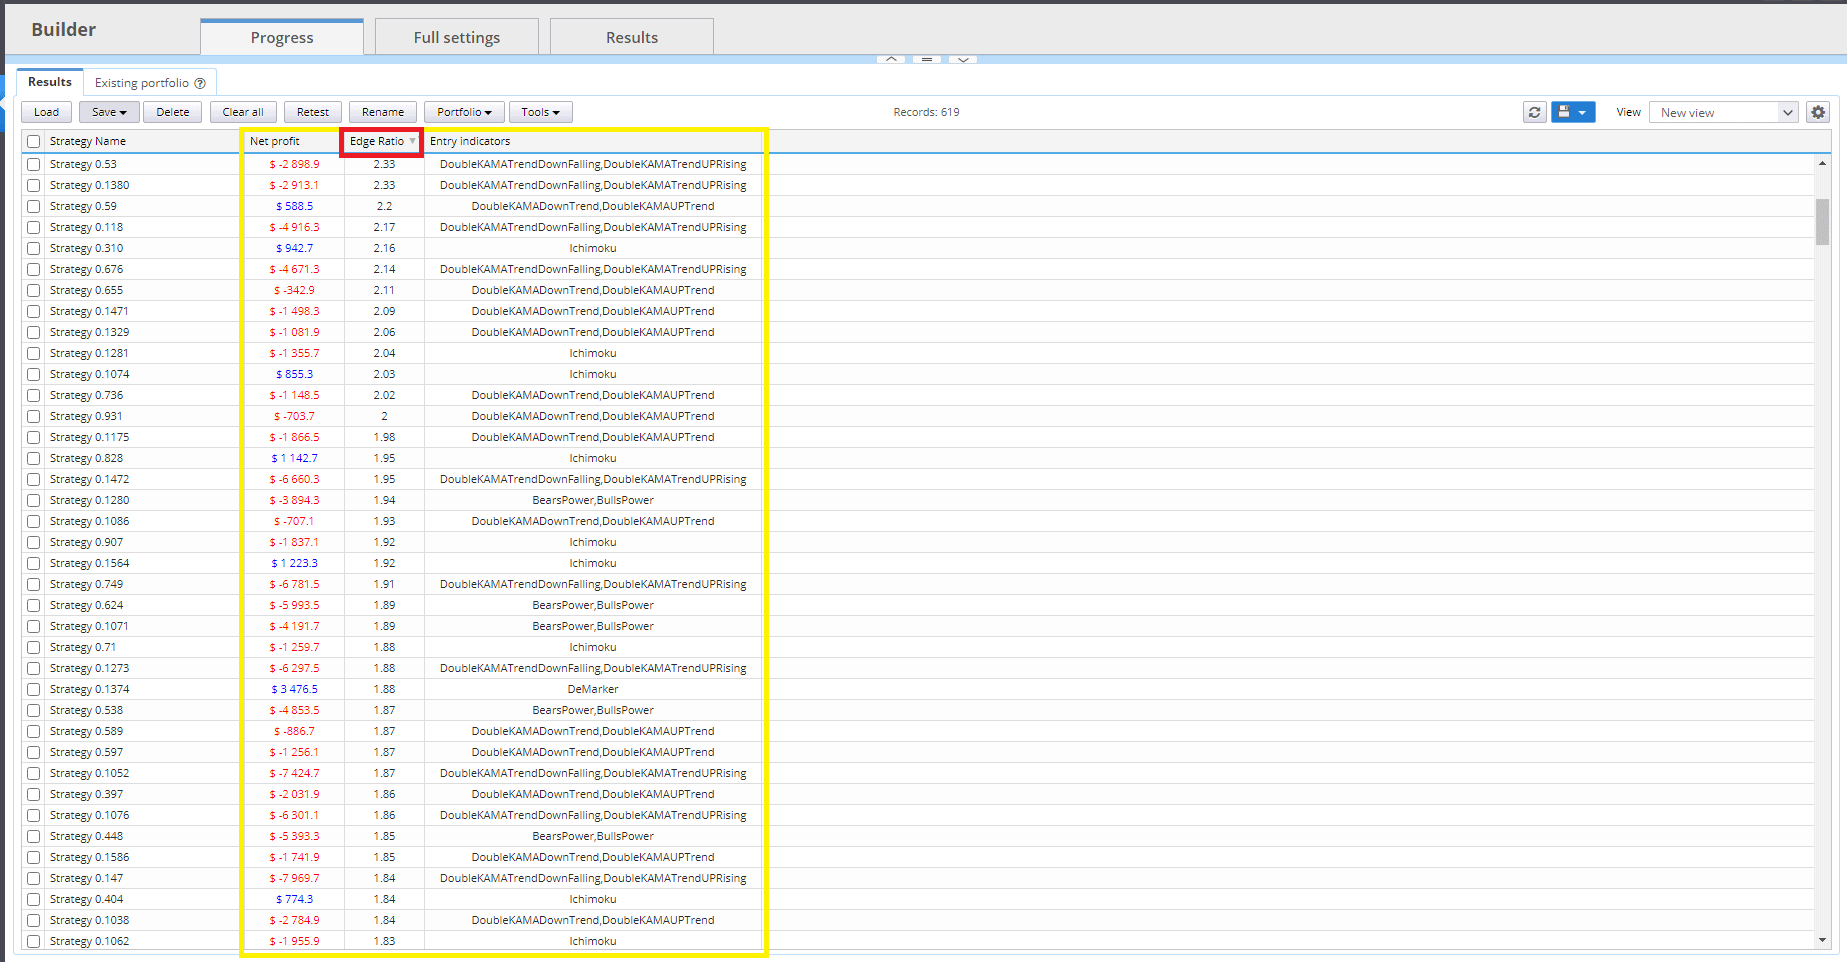
We will select the strategies with signals that have an edge ratio higher than our threshold. We choose strategies with an edge ratio higher than 1.5 .
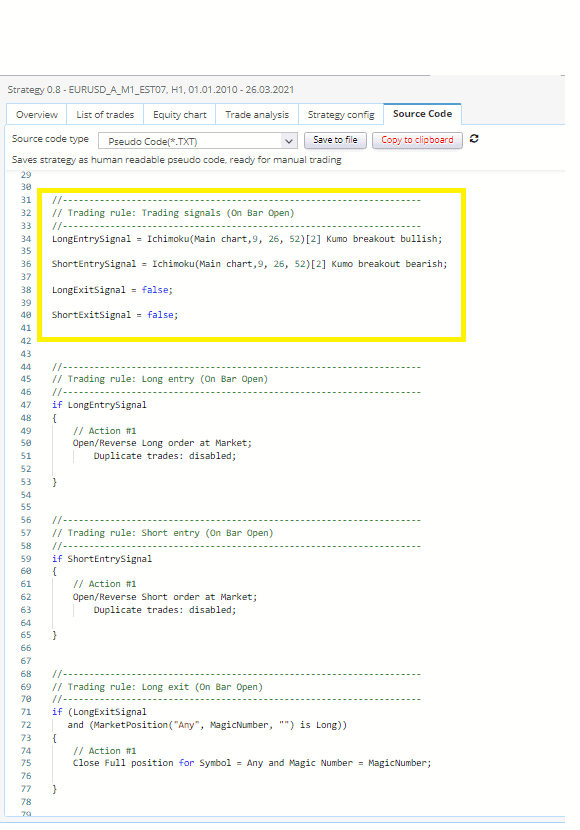
In the image below you can see what the random strategy will look like. From the pseudo-code, you can see that the strategy uses one rule to enter long and its opposing signal to enter short. This is exactly how we want to measure the quality of the signals. No other outputs, just the pure signal.
5. Evaluating signal robustness
It is a good idea to think about a possible deeper evaluation of the signals. By having strategies with very low complexity ( We have only one signal without other variables), we can analyze robustness more easily.
At this point, I recommend running a Monte Carlo test to randomize the parameters. That way you can get an idea of whether a given signal is not a statistically overfitted random chance.Or you can optimize a given signal strategy to see if the given signal parameters are robust. System Parameter Permutation – SPP is good for showing us where the signal parameter settings lie within the distribution of results.
6. Using Improver for searching proper exit and entry methods
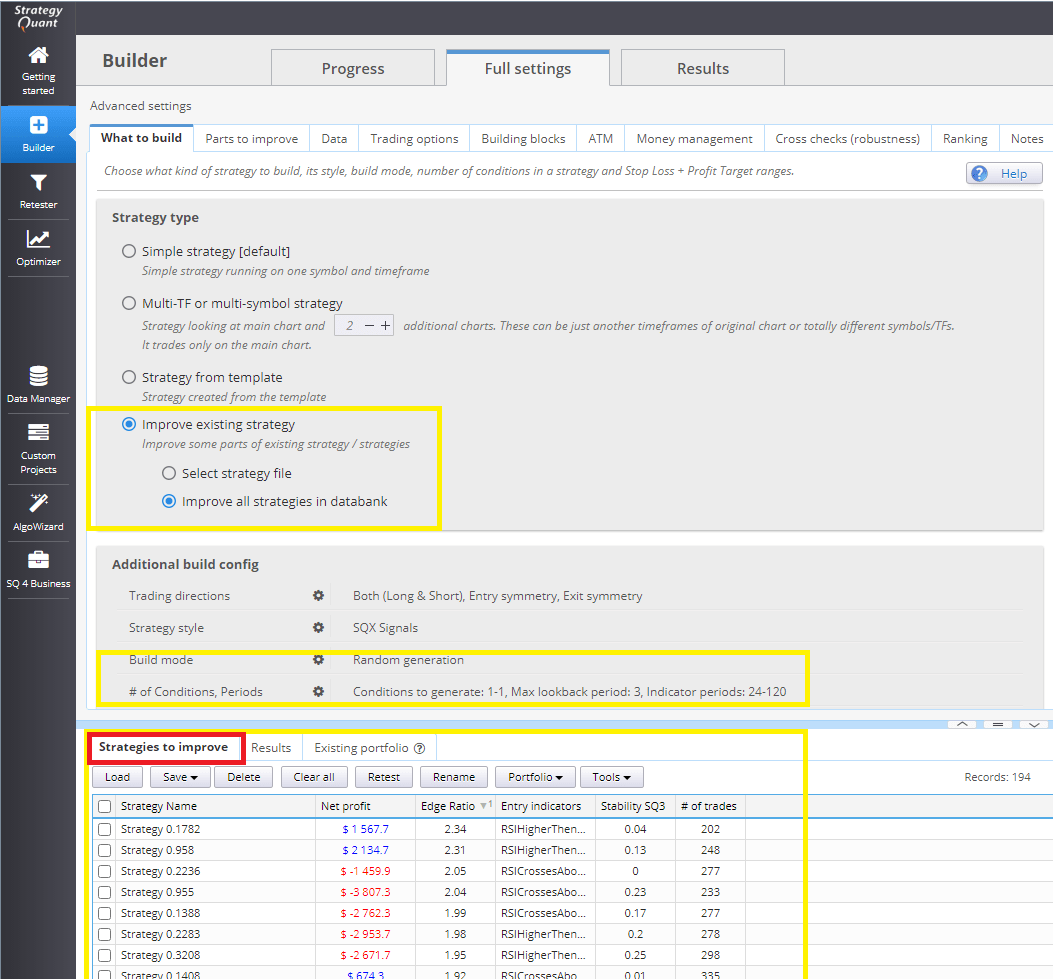
We have selected robust strategies ( signals ) and want to build strategies on them. Strategy Improver is available for this purpose. Now we can set some settings in the Additional build config more flexibly. In this case, we set Stop Loss as the required option. We also load strategies we selected earlier in step 4 into the databank” Strategies to Improve”.
In this step, we set which parts we want to improve. We will leave the signals or entry conditions as they are, we will improve only the entry/exit methods.
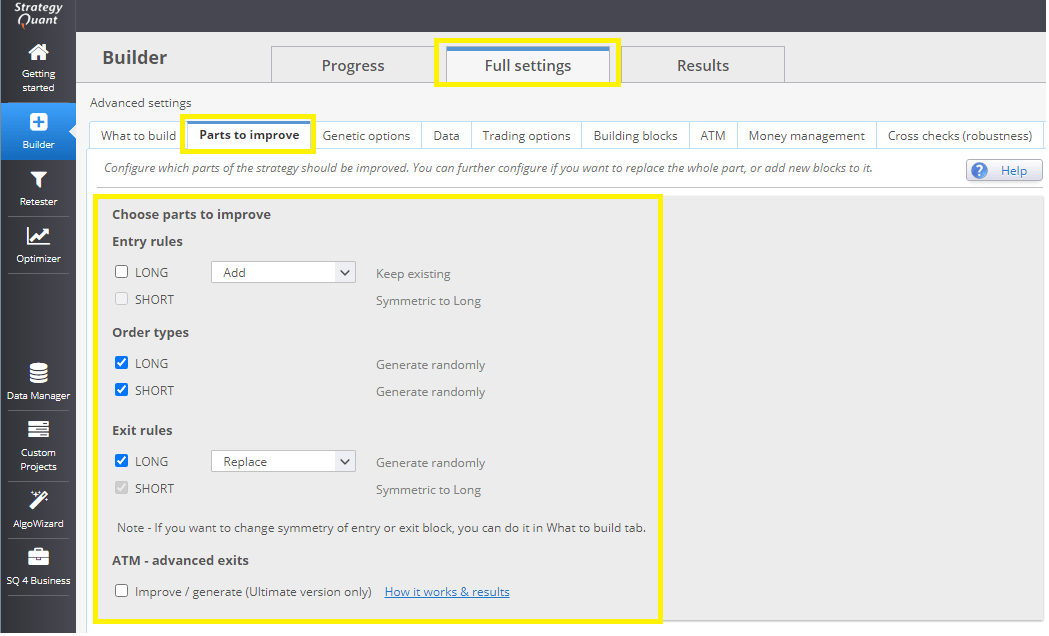
In Building Blocks, we set Entry types and Exit types. Don’t forget to add indicators and stop/limit entry blocks. If you don’t add them, the improver will not find any improvement.
Some settings in Improver work in different ways. The difference is mainly in the strategy rankings. When upgrading strategies, you set how many upgraded strategies should be in the databank, at least for the improver to skip upgrading to the next strategy. If you set a high value, the improver may not find enough strategies to upgrade and get stuck.
There is a minor bug in StrategyQuantX 131 as of 22.4.2021 that makes it impossible to use the time ranking setting correctly. It should be fixed in a few days anyway, now we have to adapt and adjust our workflow so that it will be not a problem.
The goal is to make sure the improver finds strategies, so I set the improver to find me at least ten strategies from each base strategy. It is also important to reduce the number of trades, as it is likely that the genetic engine will select strategies with stop/limit orders and therefore the number of trades will be reduced and be less than the original number of signals.
Conclusion
What’s great about this incremental approach is the fact that we can separate the evaluation phases. In step 6, we were able to analyze the signal quality separately. Now after adding the new exits we can separately evaluate the robustness of the output methods. Analyzing multi-dimensional problems at once is very difficult and error-prone at the very least.
You may have wondered how to determine if this is a better workflow than your current workflow. The solution I use is to reserve two years of data against which to validate my conclusions. Just try generating a few thousand strategies according to your workflow and validate the performance against two years of real out-of-sample data. Then try using that workflow to compare the distribution of results and make a statistical estimate of whether the average difference in strategy performance is statistically significant. In a subsequent post, we will statistically analyze this workflow and determine how efficient it is.
You can download edge ratio snippet here

 Emmanuel Evrard


great post, looking forward for the next one!
I tried this model. If We didn’t select any exit method, strategies have only one trade. Am I wrong some settings?
You have to set an exit methods in laters stages ….
You have shaped what I have been thinking without knowing it for a long time. Is a spectacular job, pure gold, I am eager to know your progress in the next blog
Excellent article !!! and very helpful !!! thank you Clonex !
Can you share the EdgeRatio.sqx?
You can find more file for the Edge Ration here https://strategyquant.com/codebase/trade-edge-ratio/ in our Codebase
Thanks for the great idea. in the first stage If I set the #of trade filter to >200 then it filters all strategies because they only took 1 trade. so I don have any strategy to continue in second stage to improve
Amazing post Clonex!!! I’m reading trough all your contributions and I must say that they are amazing reads! Hope you continue 🙂