Performing backtest of the strategy in the trading platform is a necessary step before going live. Generally, all trading platforms are performing the same tasks which are providing the environment for running our strategies live and access to the market. But once you focus on the particular trading platform then you realize that for having a reliable backtest you need to be aware of the specifications of the certain trading platform.
In this article, I will show you how to perform a reliable backtest of the strategy in the commonly used MultiCharts trading platform. We will go through the whole process starting with preparing data for generating strategies and ending with having our strategy backtested in MultiCharts. This article will primarily focus on the technical aspect of backtesting and using the right data. The following article will focus on example setting how to generate example strategies with have good performance results in MultiCharts.
How to handle data for generating strategies for MultiCharts
For obtaining a reliable backtest in StrategyQuant you need to use data preprocessed by MultiCharts. We do not recommend directly import data from source e.g. TradeStation into StrategyQuant and avoid the MultiChart data – preprocessing step. If you will avoid it then backtest results between StrategyQuant and MultiCharts will differ more.
Now let’s show the whole process step-by-step:
Import data into MultiCharts from TradeStation or a different source
MultiCharts has a QuoteManager module that allows using data from multiple sources. In this tutorial, we will show you how to deal with data from the TradeStation broker.
Note: For using TradeStation data you need to have installed TradeStation and MultiCharts on the same computer and also run MultiCharts with the admin rights.
The step-by-step tutorial follows:
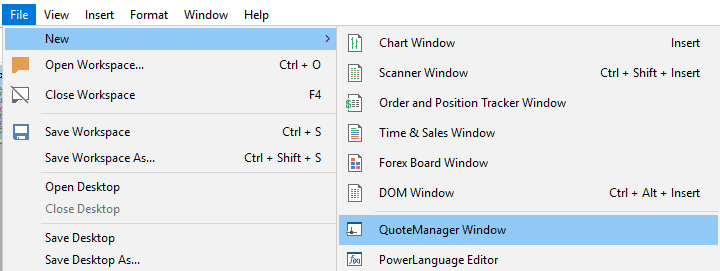
- Open Quote manager in MultiCharts
- Add new symbol
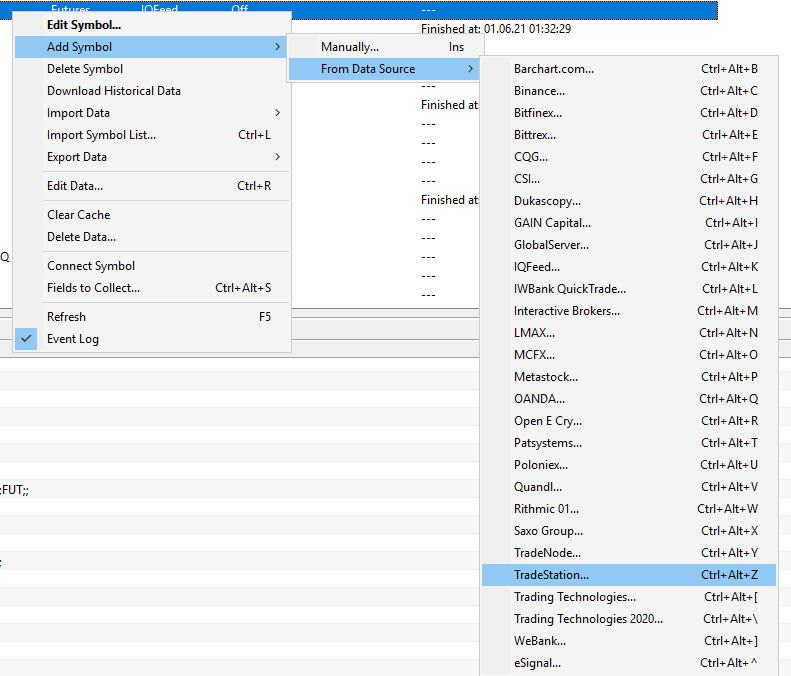
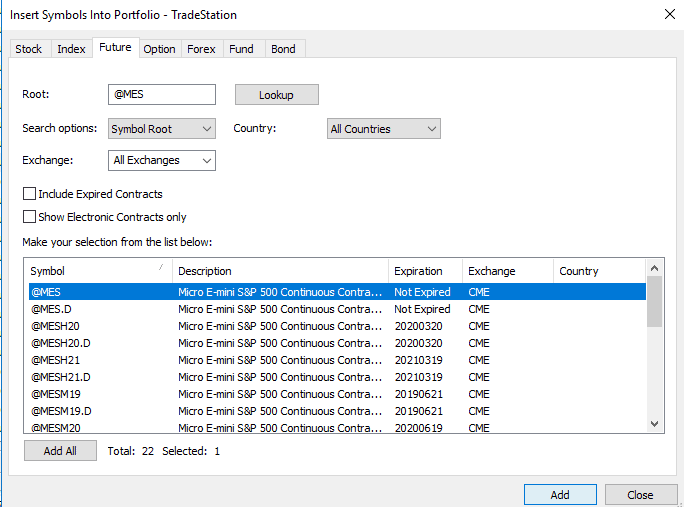
- Lookup for the symbol and click “Add” button
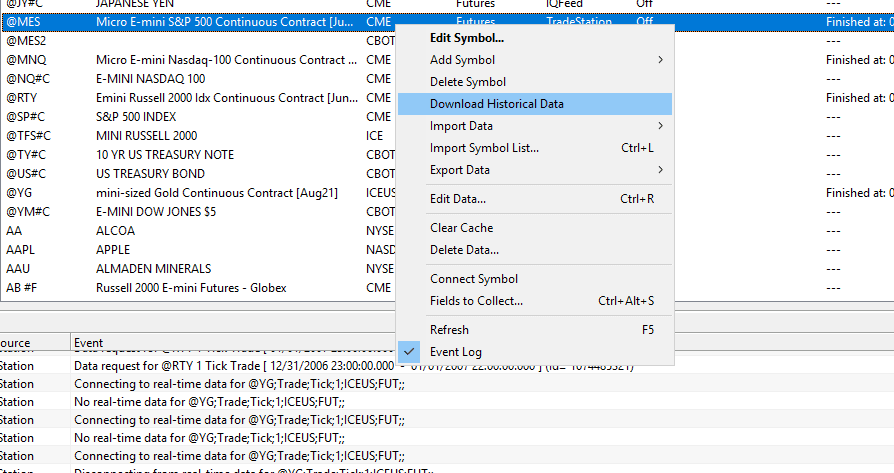
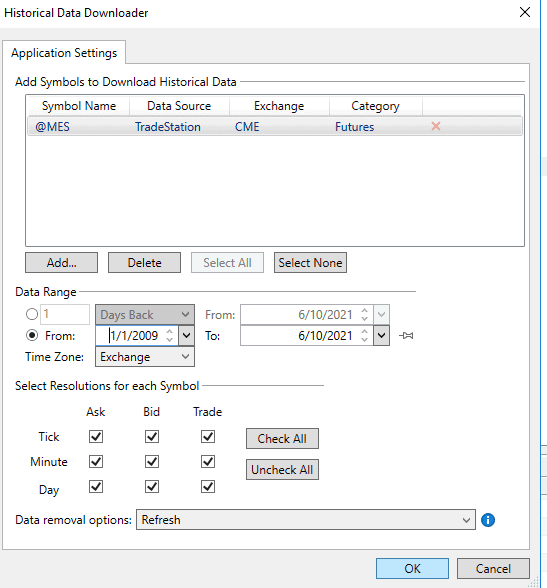
- Select the symbol in the Quote Manager, right-click on it and select “Download Historical Data”.
- Type your date range and click “Check All” button
Export data from MultiCharts into .csv file
Now is time to export data from MultiCharts into .csv file which we can import into StrategyQuant.
The step-by-step tutorial follows:
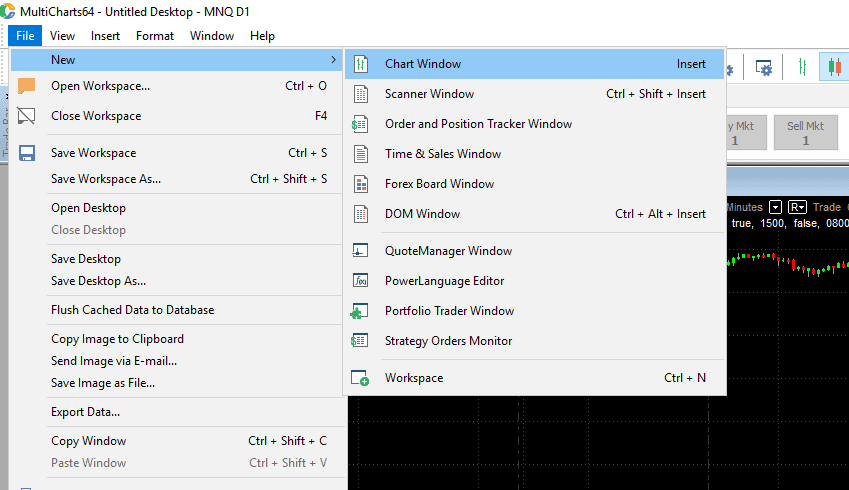
- Open new Chart Window
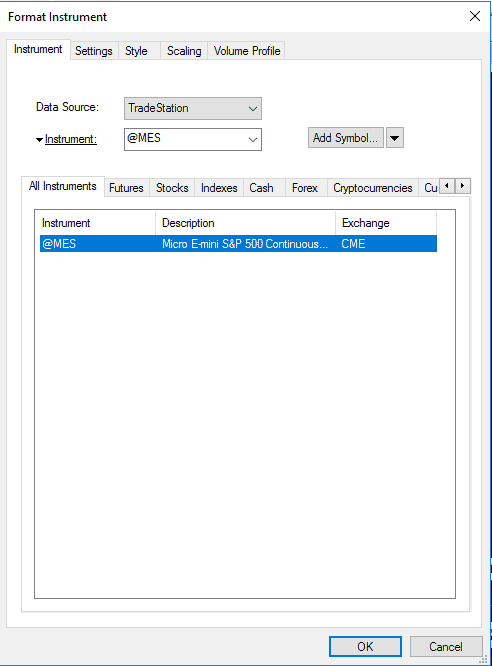
- Select instrument
- Set the timeframe and data range for downloading
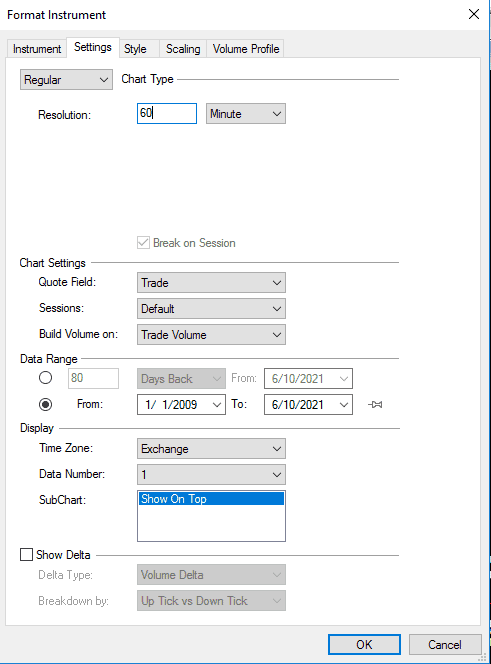
Click the “OK” and wait until the chart is loaded
Note: We will export M1 data therefore, you have to set 1-minute chart
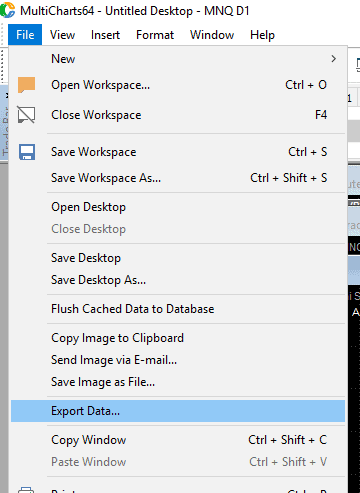
- Go to the file->Export DataAnd choose the following options:
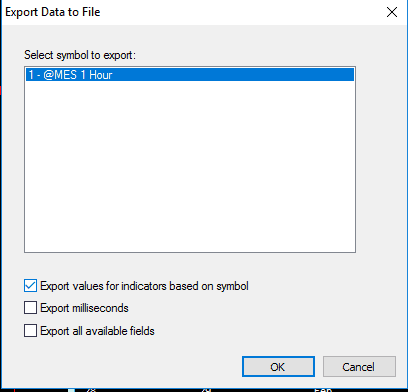
Congratulations, now you have prepared data for importing to the SQ X
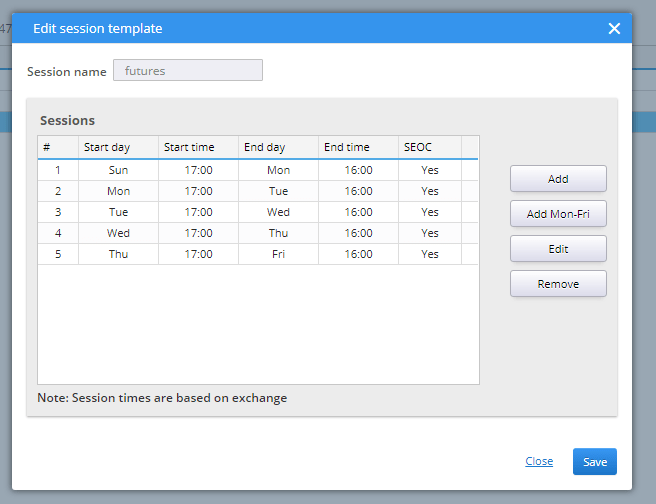
Setting up sessions in SQ X
Another important point is to have set the same session intervals in MultiCharts and StrategyQuant.
The step-by-step tutorial follows:
- In data manager click on “Add session”
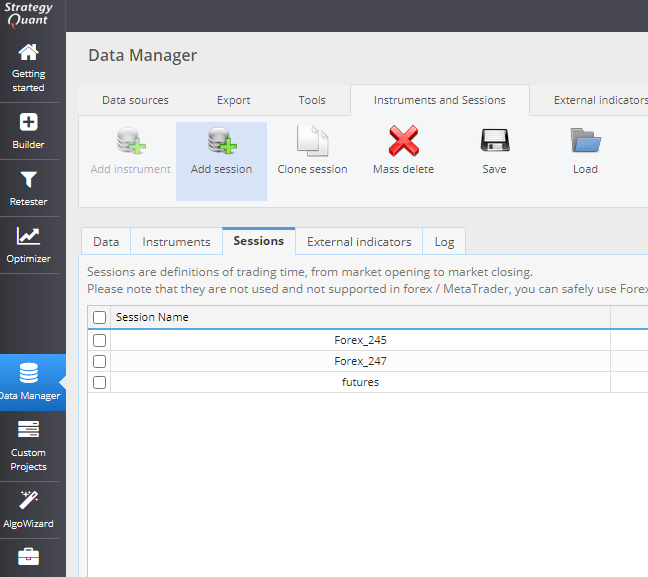
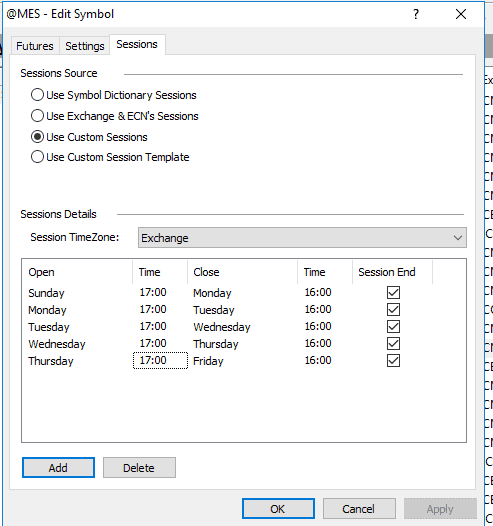
- And set the same session as you have in MultiCharts
Import data from .csv file into SQ X
Once you have data exported from MultiCharts then you need to import them into StrategyQuant X
The step-by-step tutorial follows:
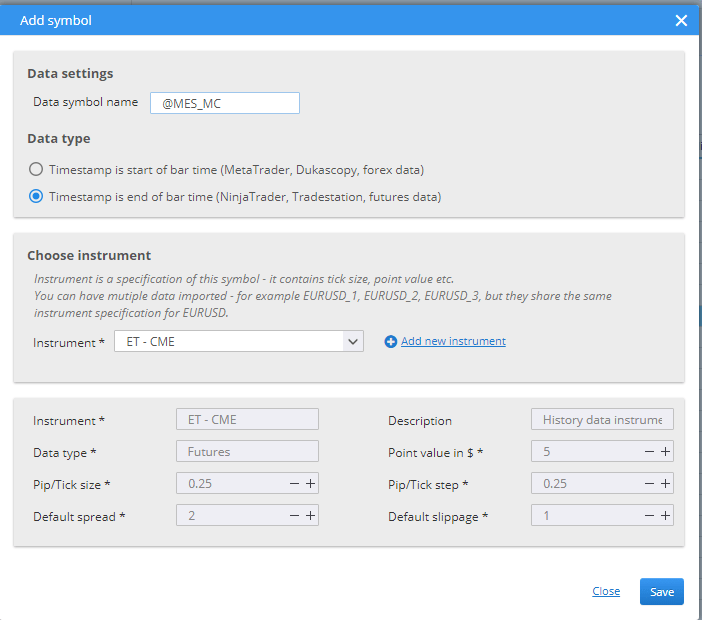
- Add new symbol in data manager in SQ X
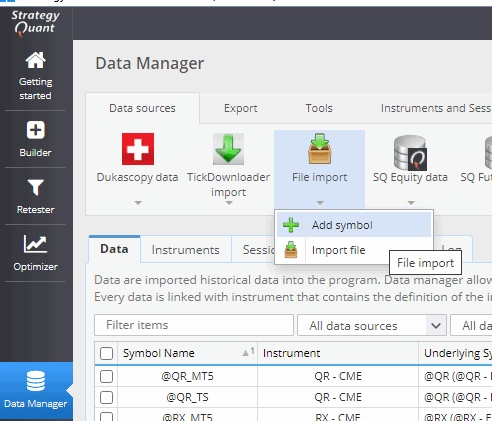
- Type the symbol name for example @MES_MC and select bar type and instrument and click on “Save”.
- We will follow with importing data from csv file. Select the symbol which you want to import:
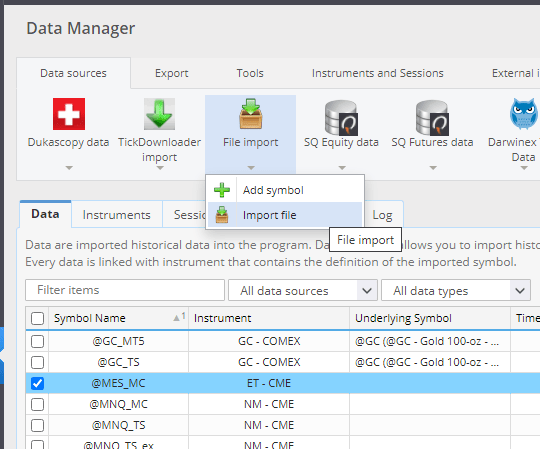
- Define required info in the import wizard.
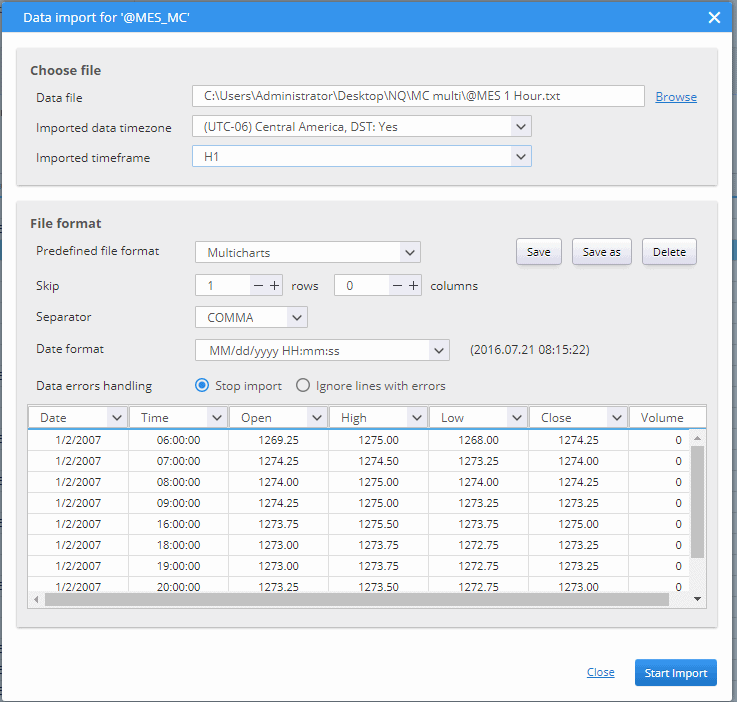
Date format: MM/dd/yyyy HH:mm:ss
If you cannot see the MultiCharts format then you can download the config and replace it in user/settings/customDataFormats.xml
Once all properties are set then you can click the “Start import”
Create trading strategies in SQ X
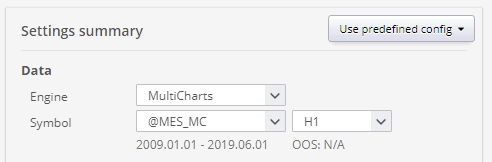
Make sure that you build strategies on the same data and sessions as you are using in your trading platform in this case MultiCharts.
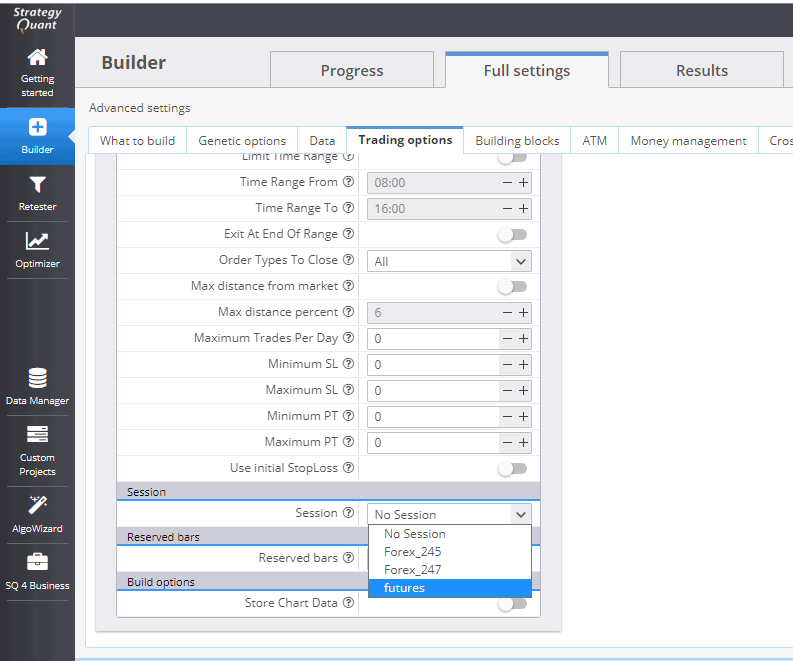
The correct “futures” session is selected
The data are ready, now you can focus on creating strategies.
Exporting strategies to MultiCharts and performing backtest
After creating some strategies, we will follow with importing them into MultiCharts and performing backtest. This is the final part of our article.
Import custom indicators into MultiCharts
Make sure that you have imported custom indicators into MultiCharts.
File with custom indicators is located in C:\StrategyQuantX\custom_indicators\Tradestation folder.
For MultiCharts, you can use SQ_MC.pla file.
For TradeStation, you can use SQ.el file.
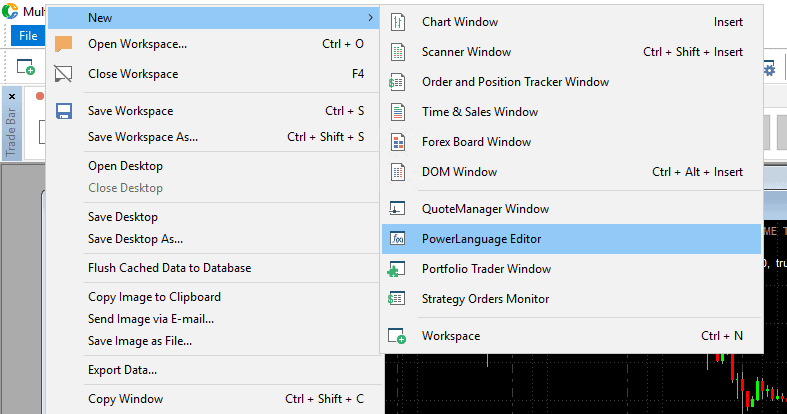
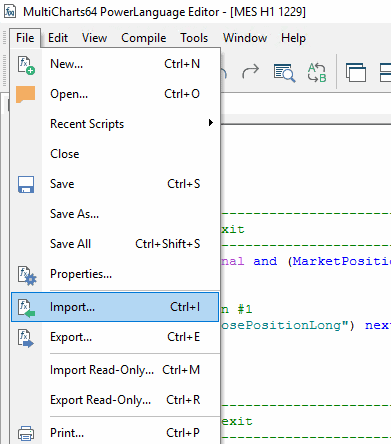
- Open PowerLanguage Editor
- Import file with indicators into MultiCharts:
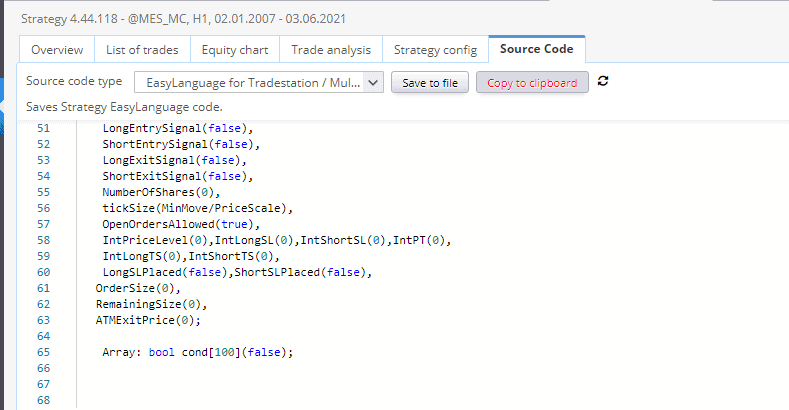
Export the code from SQ X
Once custom indicators are imported then you can export strategy source code from StrategyQuant X
- Export source code from SQ X into EasyLanguage file:
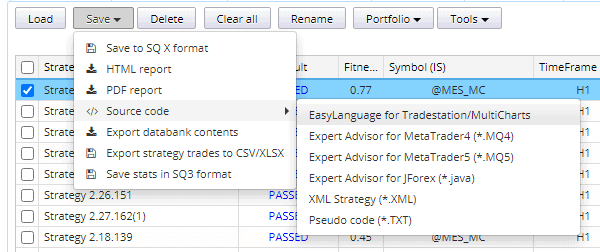
Or you can choose to copy to clipboard. In this case, use this way
Import the code to the MultiCharts
Once we exported strategy from StrategyQuant then we can import it into MultiCharts
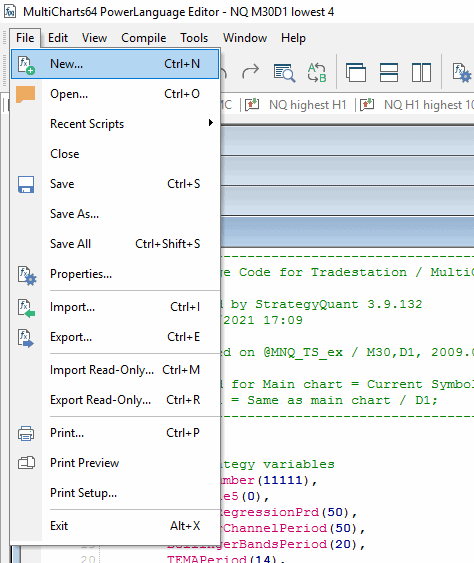
- Open power language editor
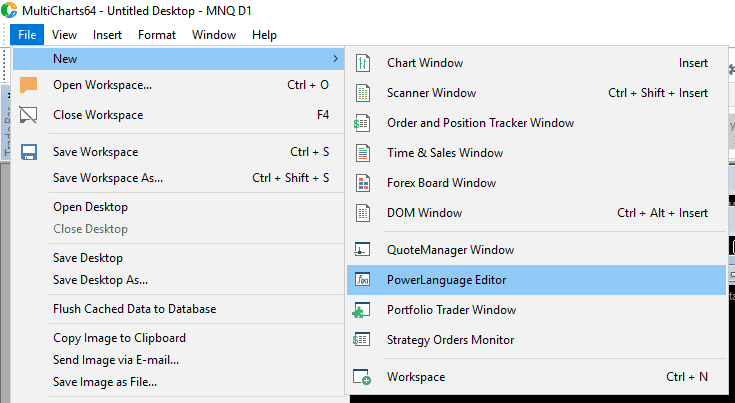
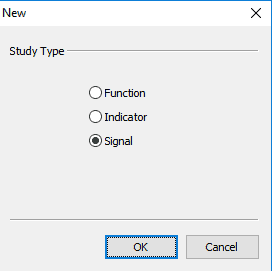
- Create new signal(Strategies are called signals in MultiCharts). Go to the file->new or press Ctrl+n key shortcut.
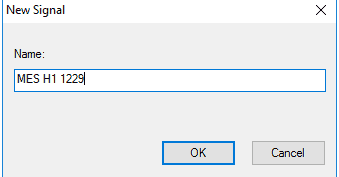
- Type signal name and confirm with ok
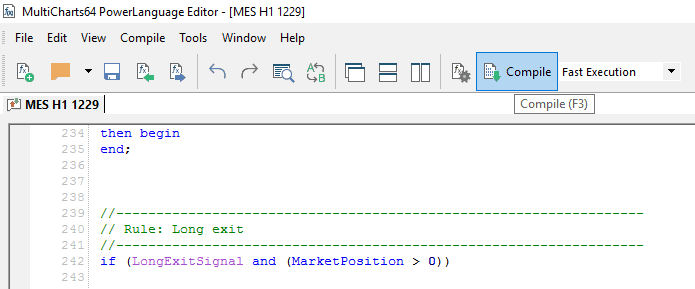
- Paste the code to the signal with ctrl+v shortcut to the window and click on compile or press F3
Backtesting
Everything is ready now to backtest your strategy in MultiCharts.
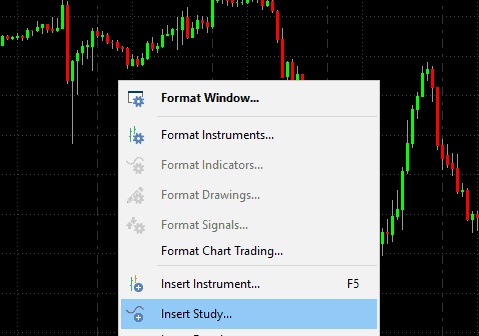
- Click with the mouse button and choose “Insert Study”
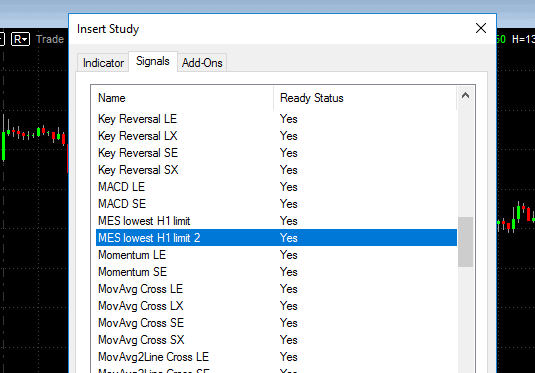
- Select your study (Strategy)
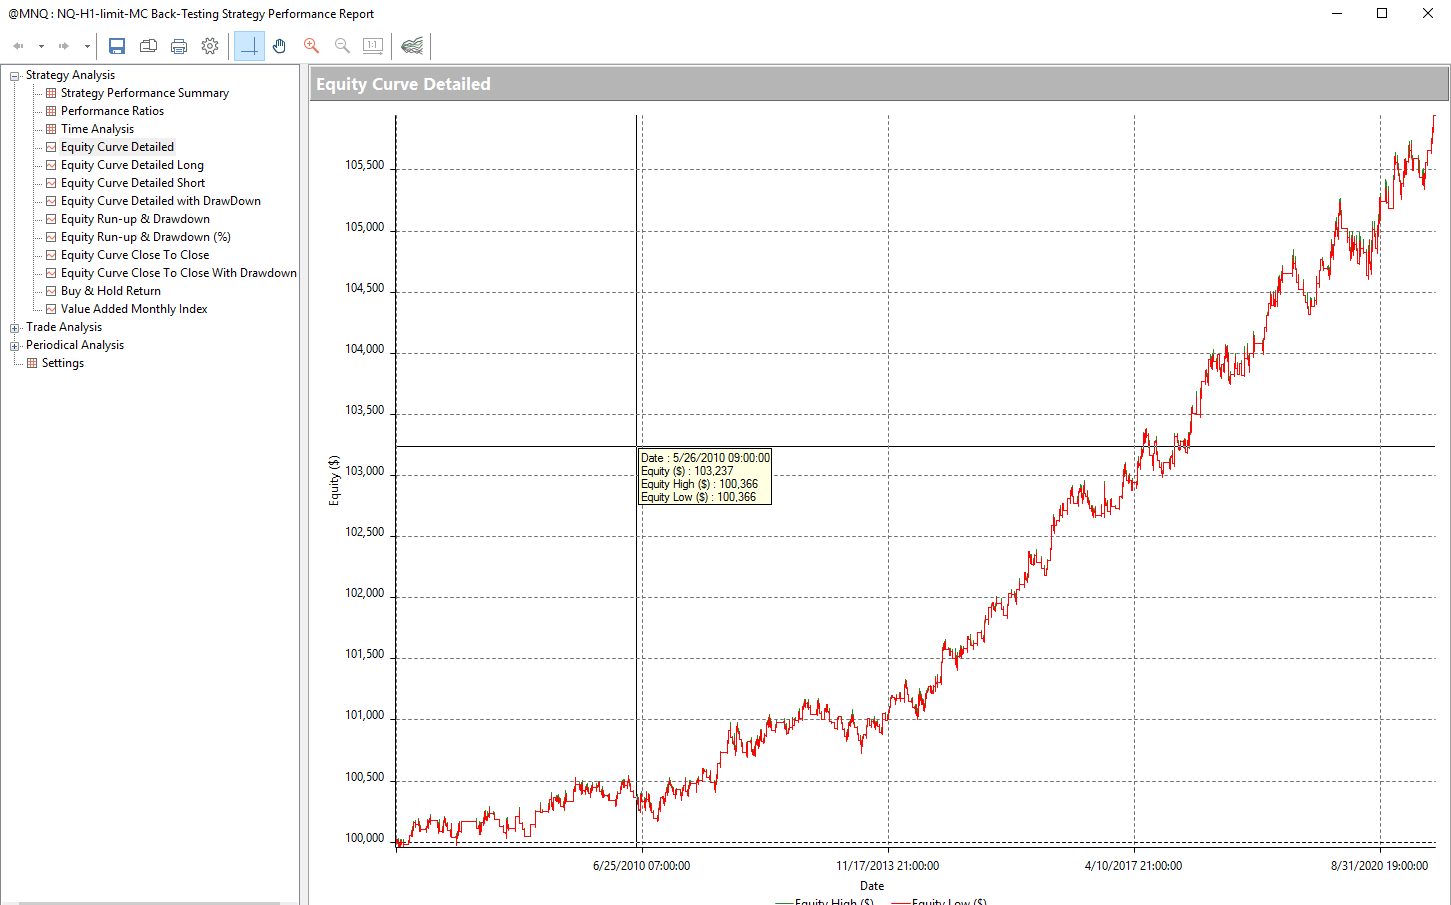
- We are done. Now the strategy will be backtested in MultiCharts. You can show its report.
Final tip: When you build strategies in SQ X for D1 then make sure that you have set up the session correctly.


 Tomas Vanek

Excellent !!!!! thank you very much
Could you show how to properly set up data and sessions for Nasdaq/NYSE regular trading hours (9:30 to 16:00) for equities?
Hello,
I have sent the setting file to your email address. Please check your inbox
Thank you! I really wish there were tutorial videos on use of SQX in MC but this is great. I can’t even find any video tutorials for MC generally anywhere. But anyway… (Silly question but I’m very new to MC) I assume I have to wait for the QuoteManager to download all the data completely before I open the new Chart I have created for that symbol and export the data from it? I ask because the chart seems to backfill the data completely, but the QuoteManager is still downloading the data. Since we are exporting M1 data, if I… Read more »