</> Codebase
StrategyQuant X platform codebase – a place to share coded customizations and extensions – among all users.
Custom Analysis
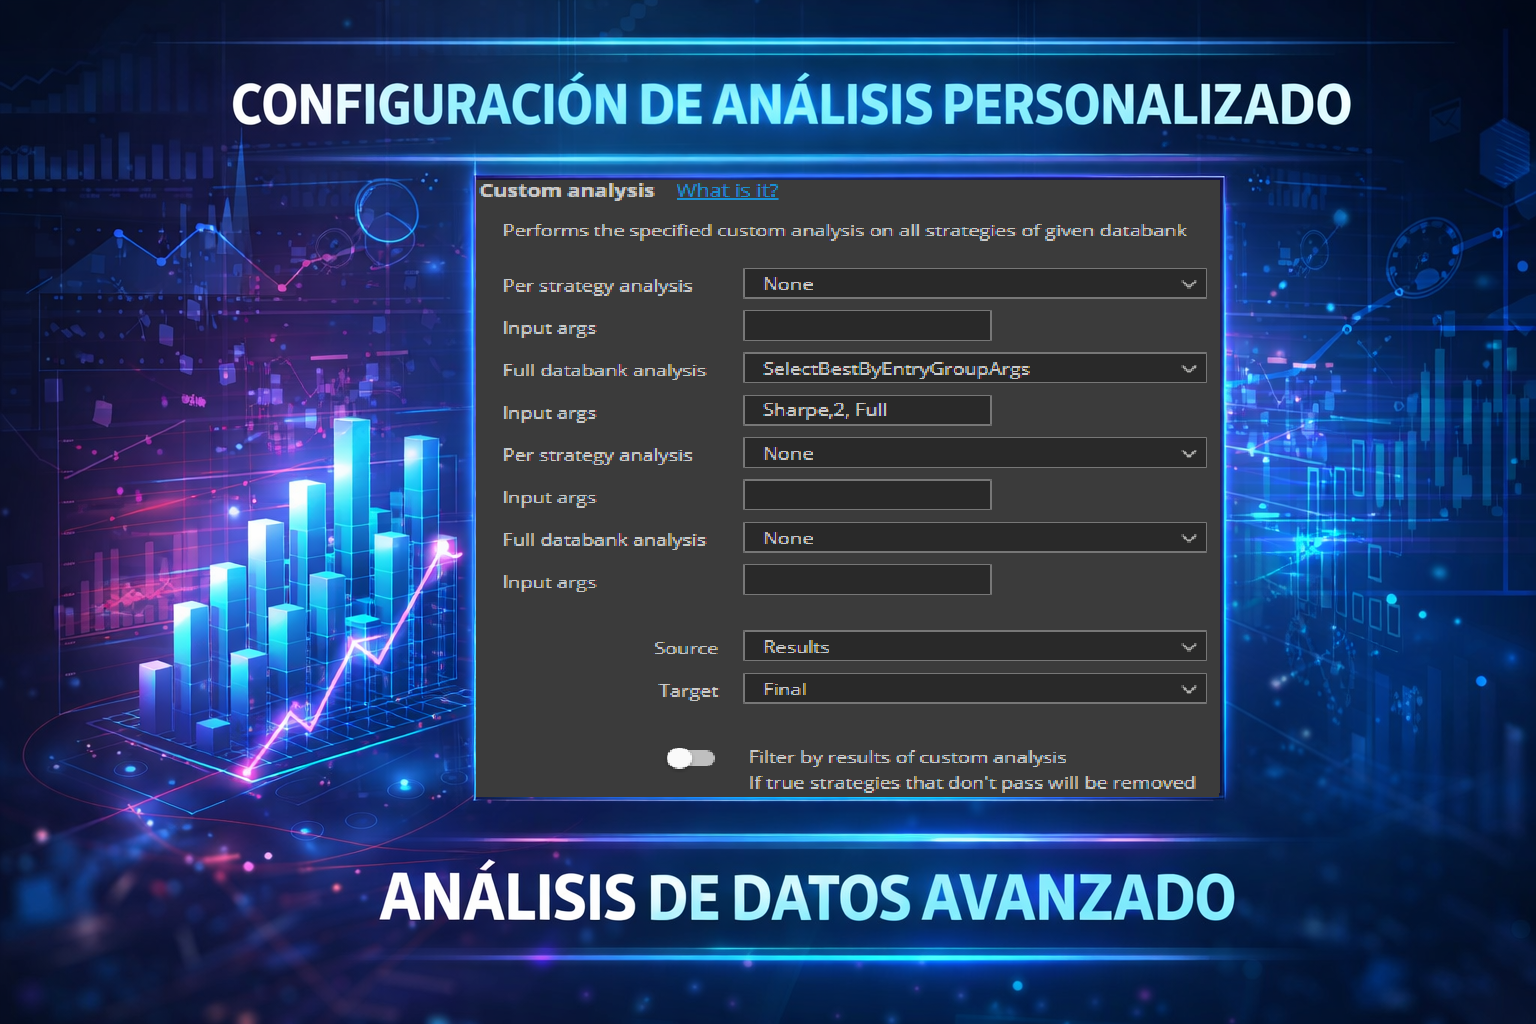
Select Best Strategies by Entry Indicators Group with Arguments
This custom analysis snippet processes a databank and automatically selects the best N strategies fr...
Result Plugins
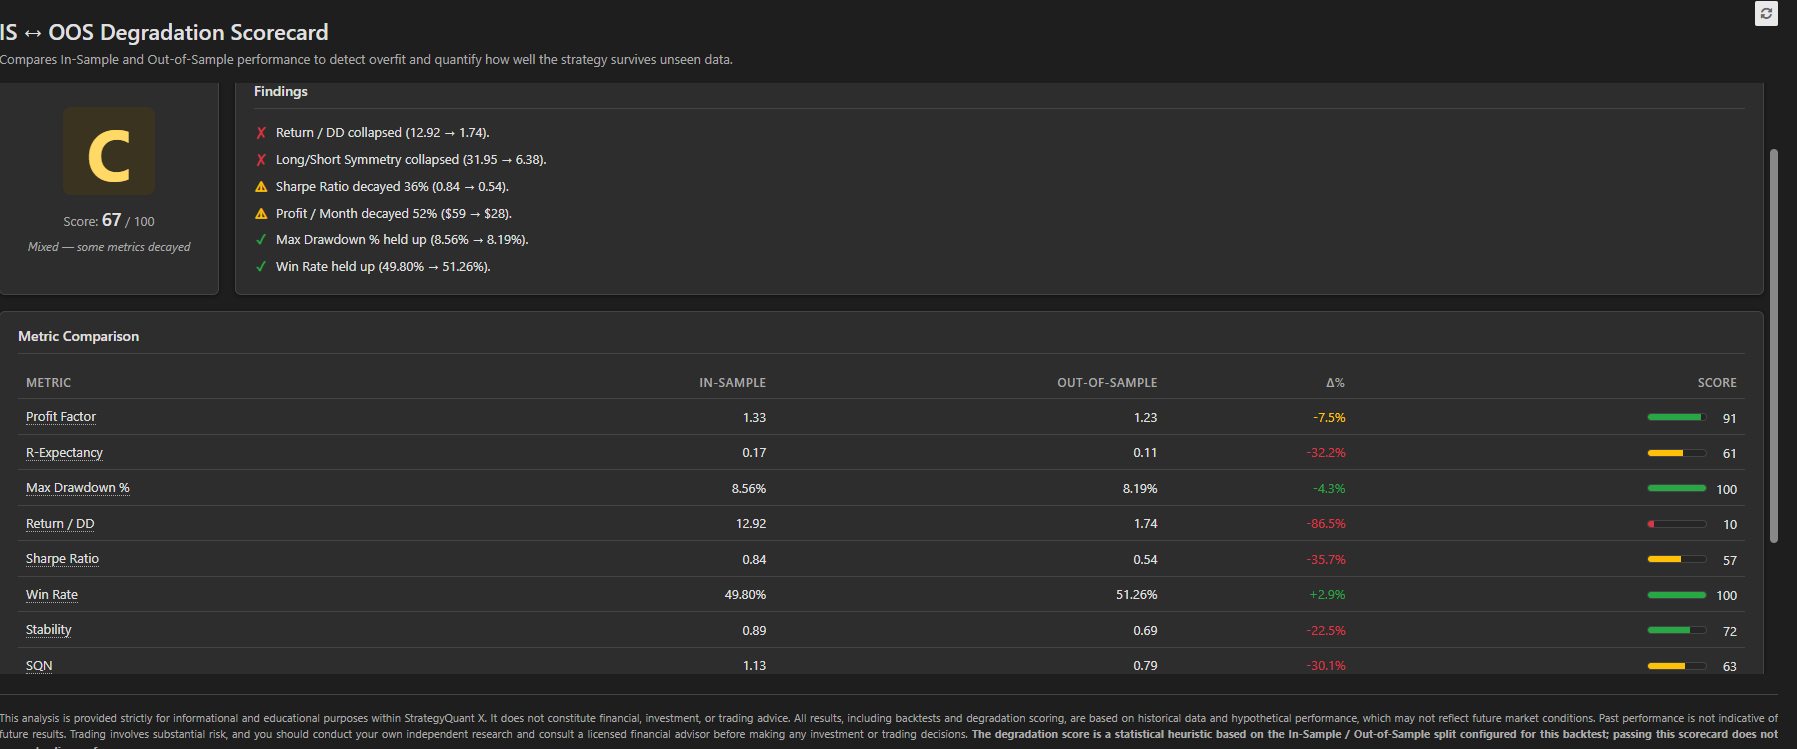
IS and OOS Degradation Score
IS ↔ OOS Degradation Scorecard turns the In-Sample / Out-of-Sample split of any backtest into a si...
Result Plugins
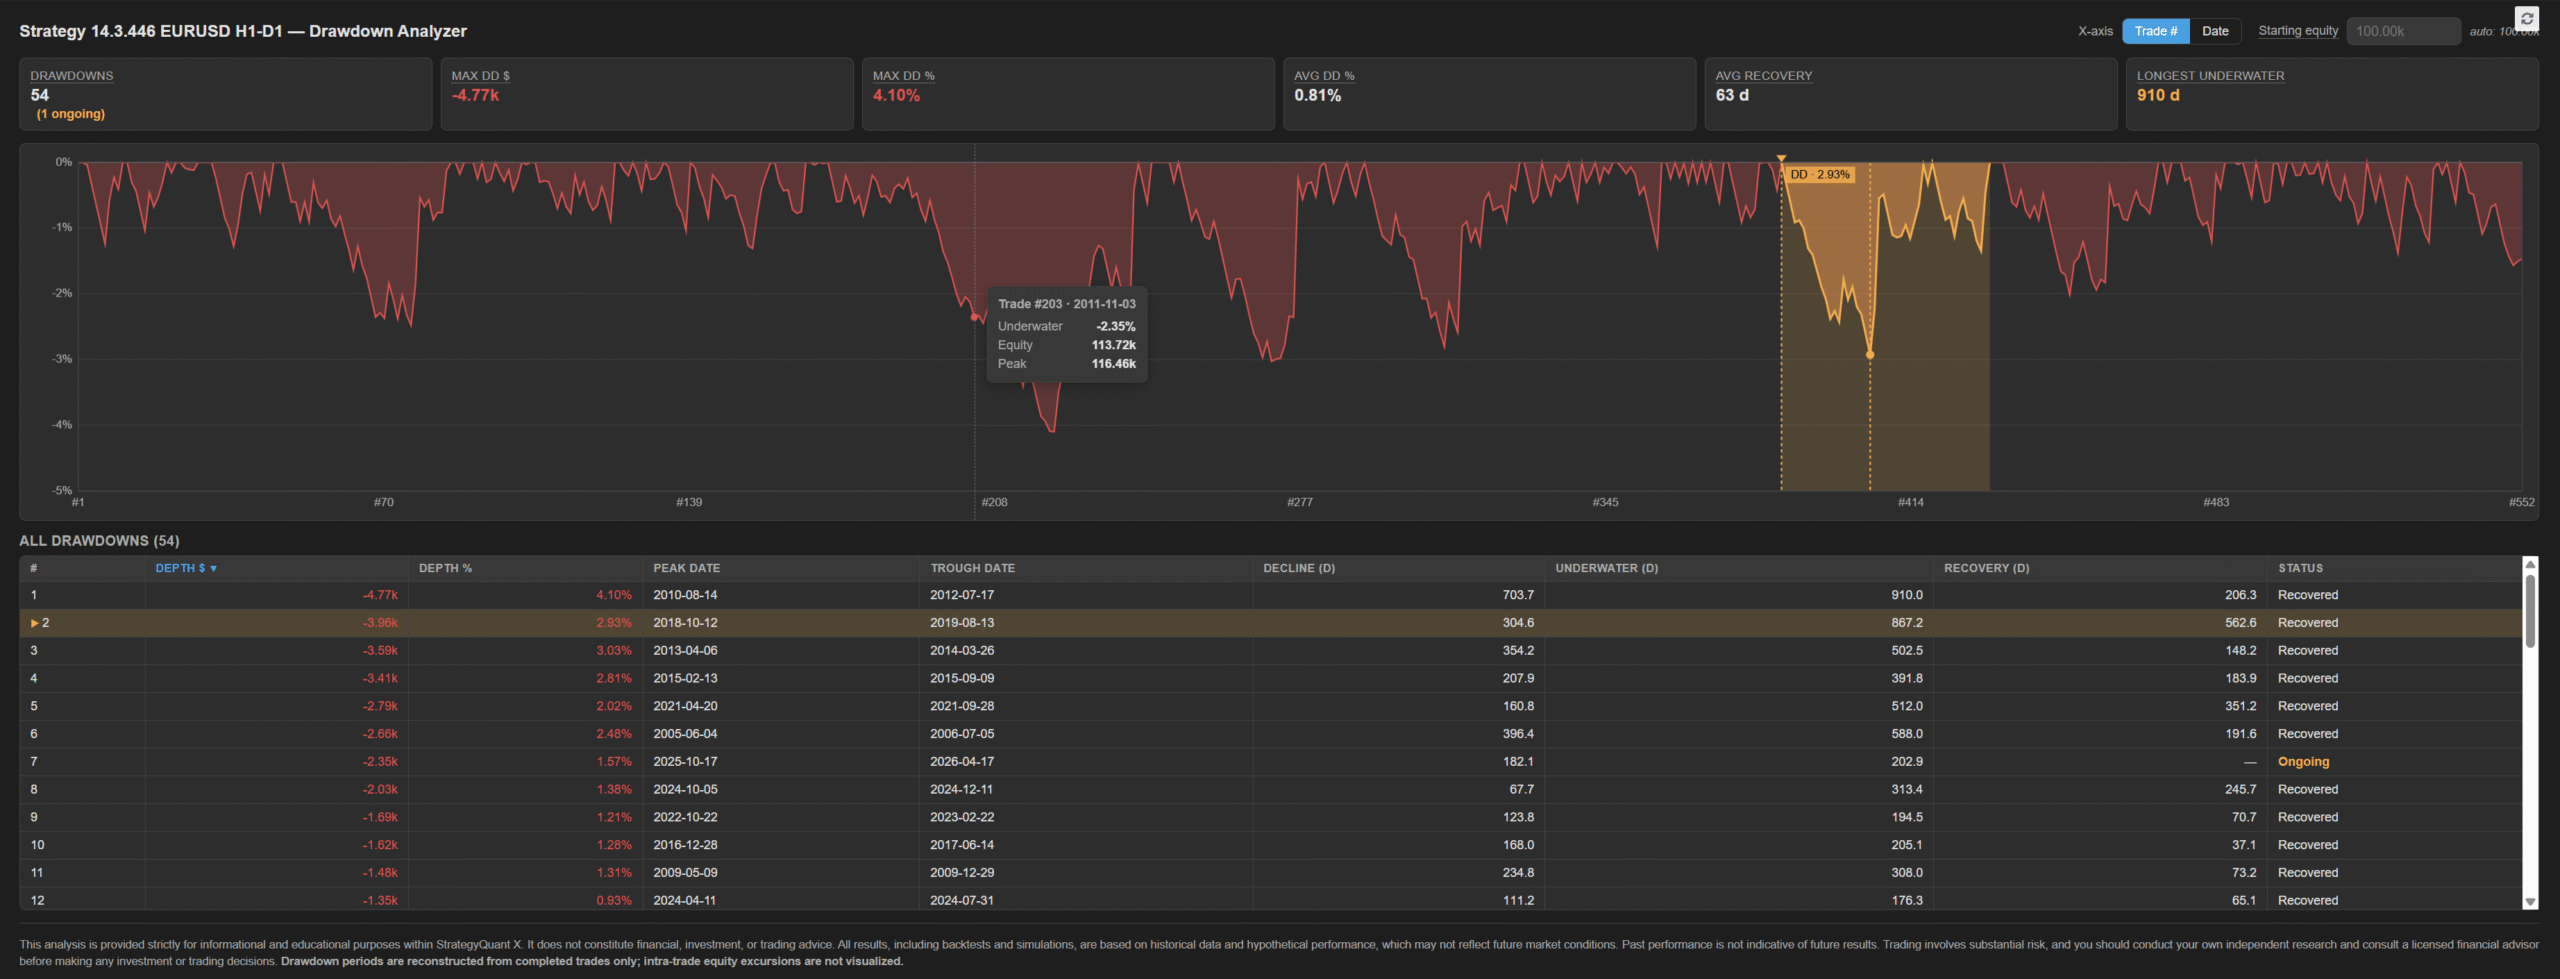
Rolling Profit Factor
A free StrategyQuant X plugin that overlays the rolling Profit Factor on top of your strategy’...
Result Plugins
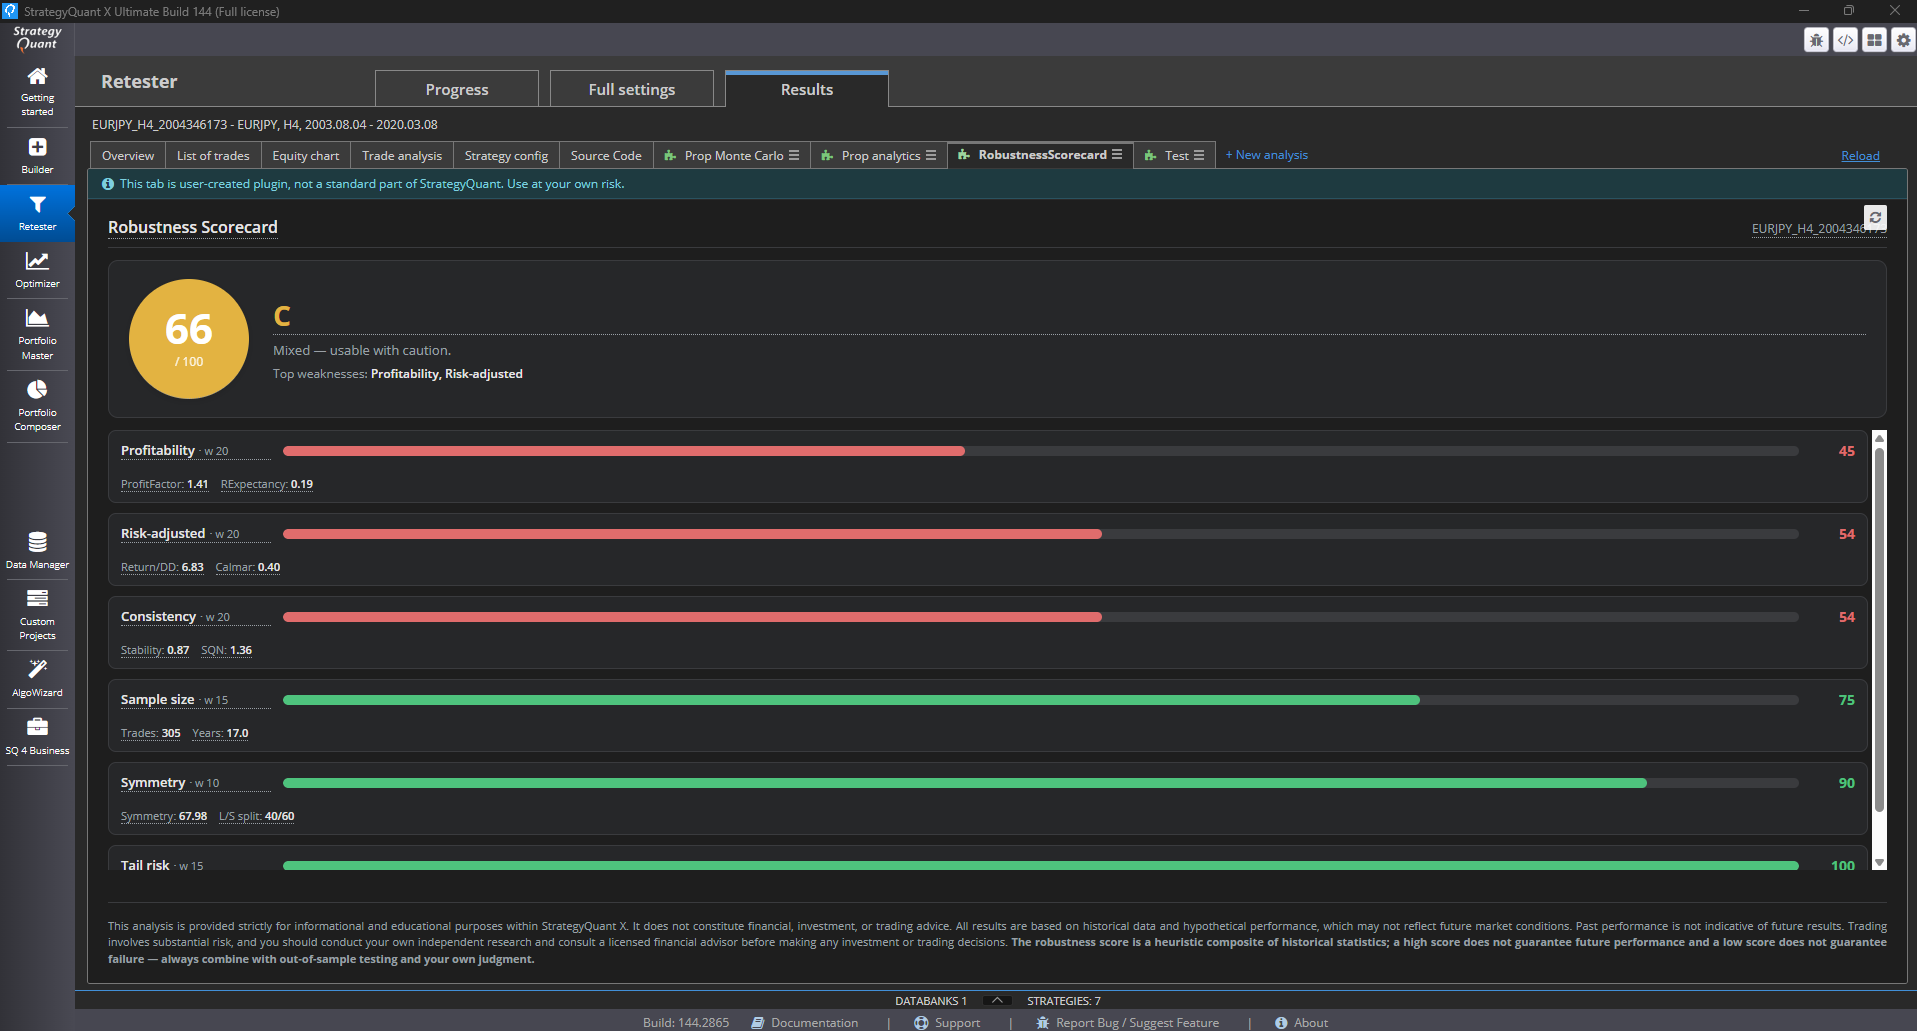
Robustness Score Card
Robustness Scorecard condenses dozens of backtest metrics into a single 0–100 score and an A–F g...
Columns
Batch Auto Rename
A StrategyQuant X plugin that adds a single-click Auto Rename button to every databank toolbar. T...

Databank / Filter
AvgNetProfit%PerBar
I give you an example of use followed by a question ???? : (A) Imagine you get 6% profit on 20 Days ...
Custom Analysis
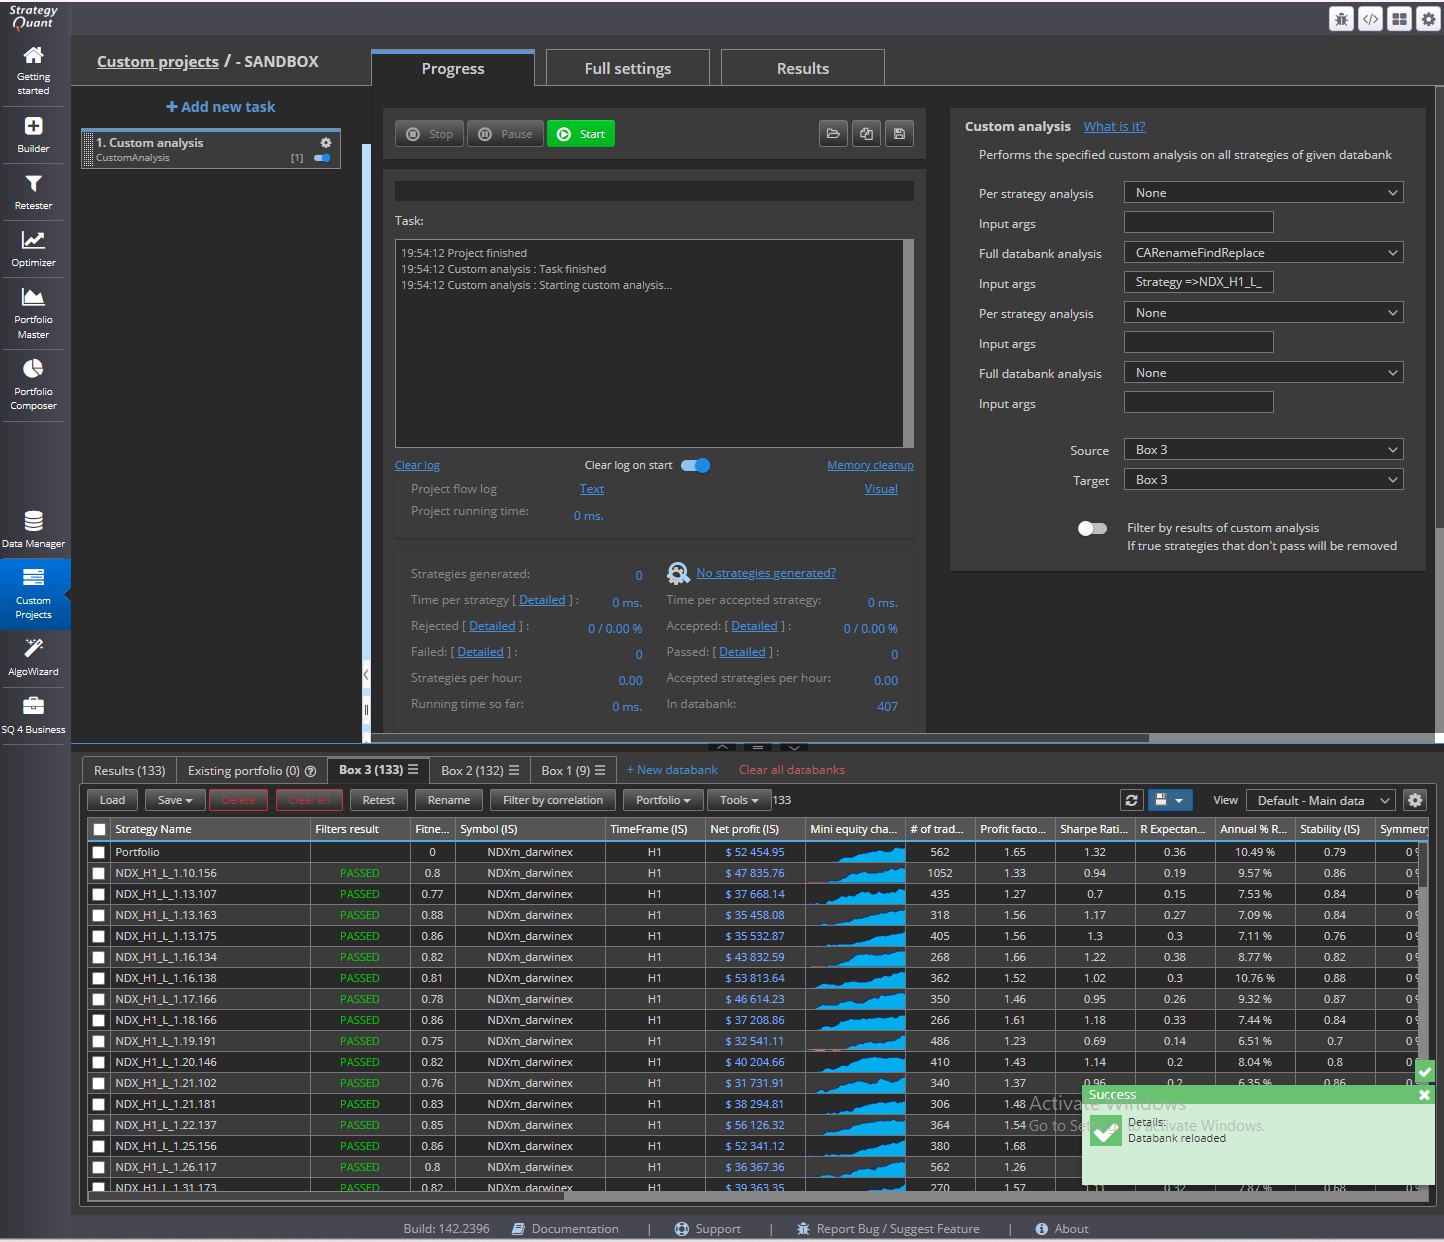
Rename Strategies with Batch Find & Replace – Custom Analysis
StrategyQuant X – Batch Find & Replace Strategy Names (Custom Analysis snippet)...
Databank / Filter
Samuel’s (Timothy Masters) Internal Profit Factor
This powerful profit factor punishes strategies for intratrade drawdown. You can read more about it ...
Indicators / Signals
Efficiency SuperTrend (EST)
The Efficiency-Filtered SuperTrend represents a significant advancement over traditional SuperTrend ...