Rolling Profit Factor
A free StrategyQuant X plugin that overlays the rolling Profit Factor on top of your strategy’s full equity curve — so you can see not just how much a system made, but when it was actually working.
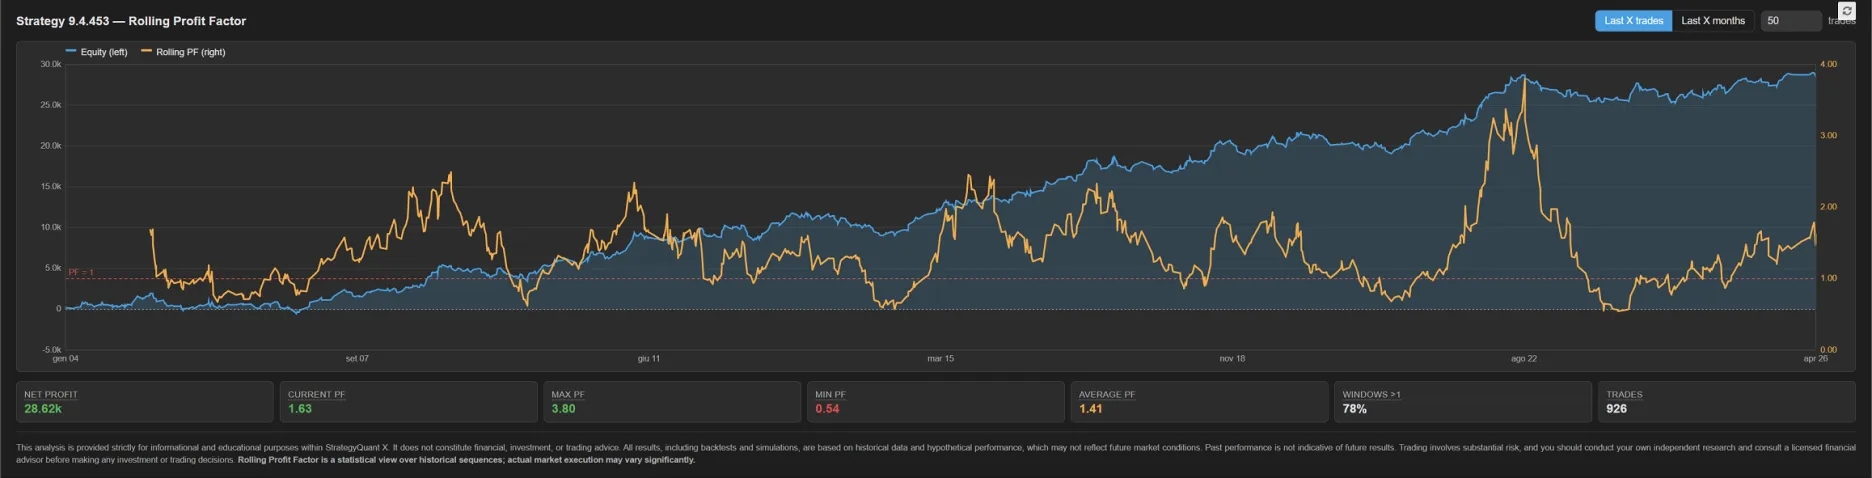
A single Profit Factor over a whole backtest hides everything that matters: a 1.7 might be a steady earner or a few lucky months that quietly stopped paying off. The rolling view recomputes PF over a moving window and plots it as a second line on the equity chart, making winning streaks, regime changes, and decaying edges easy to spot at a glance.
The rolling window has two modes:
Last X trades — measures recent performance in trade-count terms, good for high-frequency systems
Last X months — measures performance over calendar time, good for swing systems and prop-firm style evaluation
Below the chart, summary cards show net profit, current PF, max, min, average, share of windows above 1, and total trades — color-coded by the usual thresholds (>1.5 good · 1.2–1.5 ok · <1.2 weak). A dashed reference line at PF = 1 makes break-even instantly visible, and hover tooltips explain each metric in plain language. The chart uses dual Y-axes (equity left, PF right) so neither line gets squashed. Updates automatically when you switch strategies, supports light and dark themes.
Who it’s for: anyone using SQX who wants to see whether a strategy’s edge is consistent, decaying, or concentrated in a single lucky stretch — before promoting it to live trading or prop-firm evaluation.

We do not talk enough about the evolution of statistics during a backtest.
Thank you, Blaster. This is very interesting.