
22. 5. 2022
Win Rate Evolution
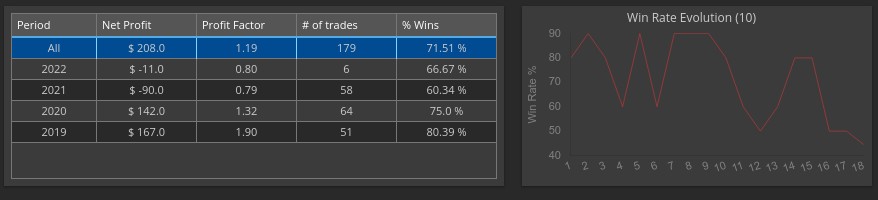
The Win Rate Evolution snippet allows the strategy developer to breakdown the overrall win rate into individual buckets. The default is set to 10 but this can be changed in the code
public class WinRateEvolution
    extends TradeAnalysisChart {

    public static int SizeOfGroup = 10;

    public WinRateEvolution() {
        this.name = L.tsq("Win Rate Evolution (" + SizeOfGroup + ")");
    }
The snippet works by grouping trades into buckets of say e.g. 10 in sequential order. The win rate is then calculated for each bucket and graphed in the chart.
So in the chart shown below, the 71.51% overall win rate is broken down and shown for the different buckets. The x-axis denotes the bucket number and doesnt not have any predictive powers, so the 7 on the x-axis is trades 61-70 which occurred in 2020.
Usages:
- Analyse deterioration of a strategy’s win rate over time, during development.
- The trader can check the out of sample/ live win rate evolution and compare against the experience from development. This give a brute method of discarding non performing strategies.
Additional Changes:
- The interested strategy developer might want to change the evolution into a moving average of the win rate. You should reach similar conclusion to the above method.
- It would be great to calculate the slope of the chart and use that as a fitness function. The more positive the slope the better.
![]()
Excellent !!! Thank you Bee !!