Understanding Max DD%
4 replies

kurtjensen
9 years ago #115424
Hi all,
I am new here.. currently evaluating Strategy Quant for a few days.
One thing that strikes me as odd, that I hope you can help me clear up, is how the max dd% is calculated.
The description in the manual says:
“Drawdown is the measure of the decline from a historical peak in running cumulative profit of the strategy. Max DD % is the maximum percentage drawdown of the strategy.”
But quite often when building strategies I see large max dd% numbers being registered, without showing up on the equity curve.
For example this one on the attached screenshot says 5513% – but wouldn’t even a 100% drawdown mean you loose your entire accounts value. So why is it not showing up in the equity curve? Apparently the equity curves of a strategy with 40% max dd does not look much different from one with 5500%??
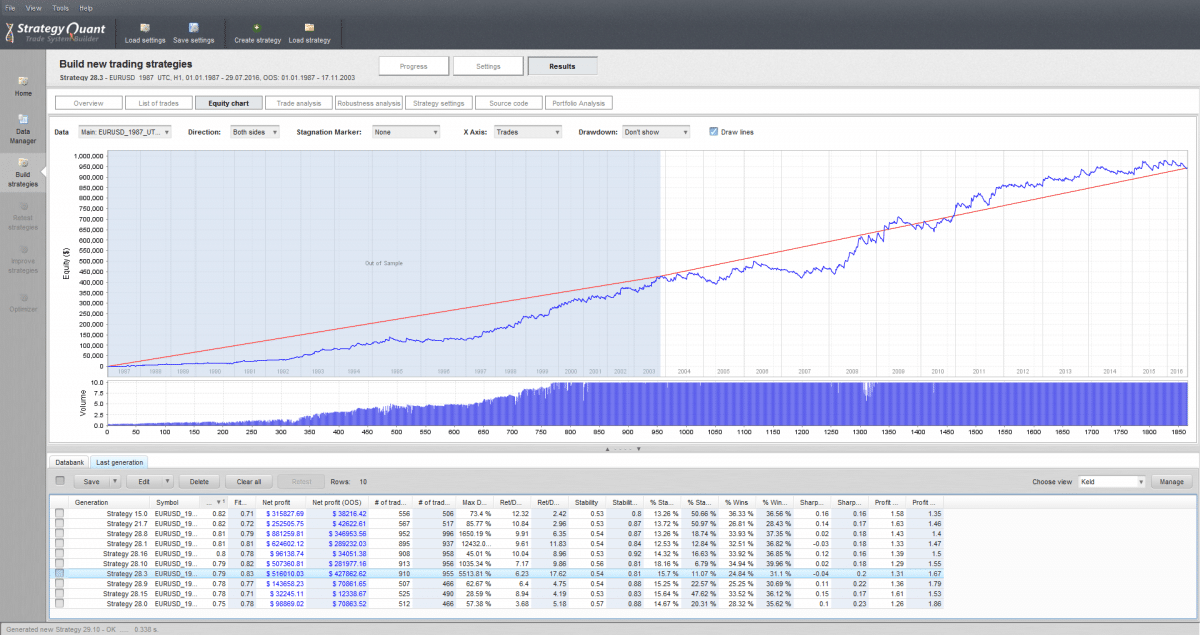 max-dd-5513-percent.png
0

mikeyc
9 years ago #138706
But quite often when building strategies I see large max dd% numbers being registered, without showing up on the equity curve.
You’ve got “show drawdown” turned off on the chart.
For example this one on the attached screenshot says 5513% – but wouldn’t even a 100% drawdown mean you loose your entire accounts value.
SQ does not stop the strategy when it has lost all the money, unlike the Metatrader 4 backtester. So you can have 500% drawdown meaning it would have lost you 5x your capital, if you had traded is over the test period. MT4 would have stopped at 100%.
Basically, your strategies are rubbish so far. 🙂
0
kurtjensen
9 years ago #138717
Ok, hmm I still don’t get it, when I turn on show drawdown in percent, it still shows a different drawdown.
Please see this screenshot:
https://www.dropbox.com/s/1j0275jyorf1h3j/Screenshot%202016-08-06%2008.55.49.png?dl=0
OOS drawdown on equity graph shows 30% but the top strategy on the list which I am viewing shows 1018% drawdown OOS.
SQ does not stop the strategy when it has lost all the money, unlike the Metatrader 4 backtester. So you can have 500% drawdown meaning it would have lost you 5x your capital, if you had traded is over the test period. MT4 would have stopped at 100%.
I understand this, but why does the equity curve not show the 500% drawdown – logically the equity curve should show that it goes in minus. Can we even trust the equity curve then? Or is it the Max DD% that is somehow wrong? It has to be one or the other imho.
0

pknoell
9 years ago #138732
I guess it’s the DD% from the robustness test. That’s always higher than the normal historical one.
0
tomas262
9 years ago #138792
Hello, you can upload you strategy I can have a look at the trade list and compare DD values
0
Viewing 4 replies - 1 through 4 (of 4 total)