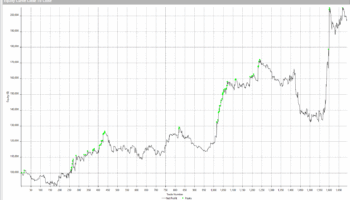
In this article, I will cover a very basic view of how to construct a portfolio that is well diversified. The basic simple approaches to achieve this are:
- Diversification between different types of trading systems
- Diversification across different markets and market segments
- Correlation analysis of trading systems
In my practice I use a combination of all of the above. Anyway, even using each approach separately will add value to your trading and the corresponding synergies and risk-adjusted performance enhancements to your trading.
I use the first two approaches mentioned as the cornerstone of the portfolio concept, which I then mathematically verify as a hypothesis. However, it is certainly an effective tool for people who do not have enough relevant data to construct a portfolio with mathematical verification of the correlations of the various systems in the portfolio.
Different types of systems
The first option, which I use to a lesser extent but nevertheless, is to trade different types of systems within a single market, or highly correlated markets such as stock indices. By system type, for this purpose, I mean the principle on which the trading system is built or the movement of the market that the system trades. For example: volatility breakout, mean reversion, …
In this case, we can construct a portfolio from different types of systems in the following way, for example:
- intraday volatility breakout
- swing long breakout
- mean reversion.
This would be a small portfolio where each system involved trades a different type of market movement, expressed by a different principle.
However, in this method it is necessary to know the “type” of the system, which for those who rent systems, whether in the form of autotrading, signals, social trading, … It is not very realistic or it is up to the provider to provide this information to clients or not.
Different markets and market segments
This offers another simple and robust approach that can be used, even without detailed knowledge of the systems. This approach is suitable for traders who, for various reasons, do not have the data for more detailed analyses or do not yet know more advanced ways of verifying correlations within the know-how and also especially for investors who want to use / use the services of external developers and subsequently trade the systems in an autotrading manner.
The whole principle is extremely simple and consists of diversification between individual markets or market segments.
Commodity markets, which are mainly traded in the form of futures contracts, are generally divided into market segments such as: grains, meats, energy, metals, indices, softs, … and further these segments (sets) into the individual markets that fall within them, for example, energy includes: crude oil, natural gas, gasoline, ethanol, … softs: coffee, cocoa, cotton, sugar, …
At first glance, it is clear that some markets within a segment have more in common and others have less. Some show positive or negative correlations and others are independent of each other and have almost nothing in common. This is the key to successful diversification.
Of course, here too, when making decisions, it is important to think at least in the following terms: crude oil and heating oil are different but, on the other hand, very similar markets. And thus correlation is possible (and in this case very likely). Whereas the pairs of markets natural gas and cotton, or crude oil and cocoa, on the face of it have less in common.
This is the key to follow even if you have no or very limited quantitative data to analyze further. However, if it is even slightly possible or if you have backtests, tradelists, … of individual systems, I definitely recommend a deeper correlation analysis of the individual systems you are considering when building your portfolio. Even though they are different markets, some combinations may be more suited to each other, others less so. And even if a hypothesis seems logically correct, it is always a good idea to test it quantitatively.
Correlation analysis
Once you have the data (tradelist), it is possible to use a quantitative approach, e.g. in the form of correlation analysis. However, correlation analysis can be used in several ways.
- It can be used for intermarket analysis and thus the analysis of correlations between individual traded markets (underlying assets).
Here, for example, data from the Moore Research institute can be used: https://www.mrci.com/special/correl.php to help you understand the correlations between the underlying assets. You can then use this to avoid trading the same type of system in two admittedly different but highly correlated markets. This is the fundamental prevention of highly correlated results for individual trading systems.
- Another use is to analyze correlations between trading systems.
Overall, the goal and purpose of correlation analysis used in portfolio composition is to ensure the highest possible equity stability and therefore reduce the volatility of our trading results. For this reason, what we are primarily interested in is the correlation of losing trades of individual trading systems, which is precisely to avoid grouping losing trades on the same days, weeks, months.
For simplicity and our needs, we look at the distribution of correlations as follows:
-1 – -0.3 => negative correlation
-0.3 – + 0.3 => independent of each other
– 0.3 – 0.5 => moderate dependence
– 0.5 – 1 => high dependence
What we are looking for when composing a portfolio are straightforward levels of correlation between -0.3 to + 0.3. If the correlation coefficient is at this level, it tells us about the independence of the trading systems.
Conclusion
Each of the above approaches has its strengths and limitations. Each can be used independently. But the best result is clearly achieved by combining all the above approaches.
Thus, the ideal is to trade different types of systems that trade different market movements, to use markets within the portfolio that are not highly correlated, and to select for the portfolio systems with the lowest possible correlation of primarily losing trades.


