Over the past few months, we have added several new indicators to StrategyQuant X that you can use to develop new strategies or as building blocks in Algowizard. In the next post, we will introduce each of them.
First, let’s repeat how to import custom indicators to SQX:
Volume-Weighted Average Price (VWAP)
In finance, the volume-weighted average price (VWAP) is the ratio of the value of a security or financial asset traded to the total volume of transactions during a trading session. It is a measure of the average trading price for the period.
Typically, the indicator is computed for a period of one day, but it can be measured between any two points in time. This implementation uses open, high , low, and close prices.
The indicator has one parameter:
We have added these basic conditions:
- Close is above/below VWAP
- VWAP is rising/falling
- Fast VWAP is above/below Slow VWAP
The Indicator is implemented in MetaTrader 4, MetaTrader 5, Tradestation, and Multicharts.
You can download the indicator and conditions here.
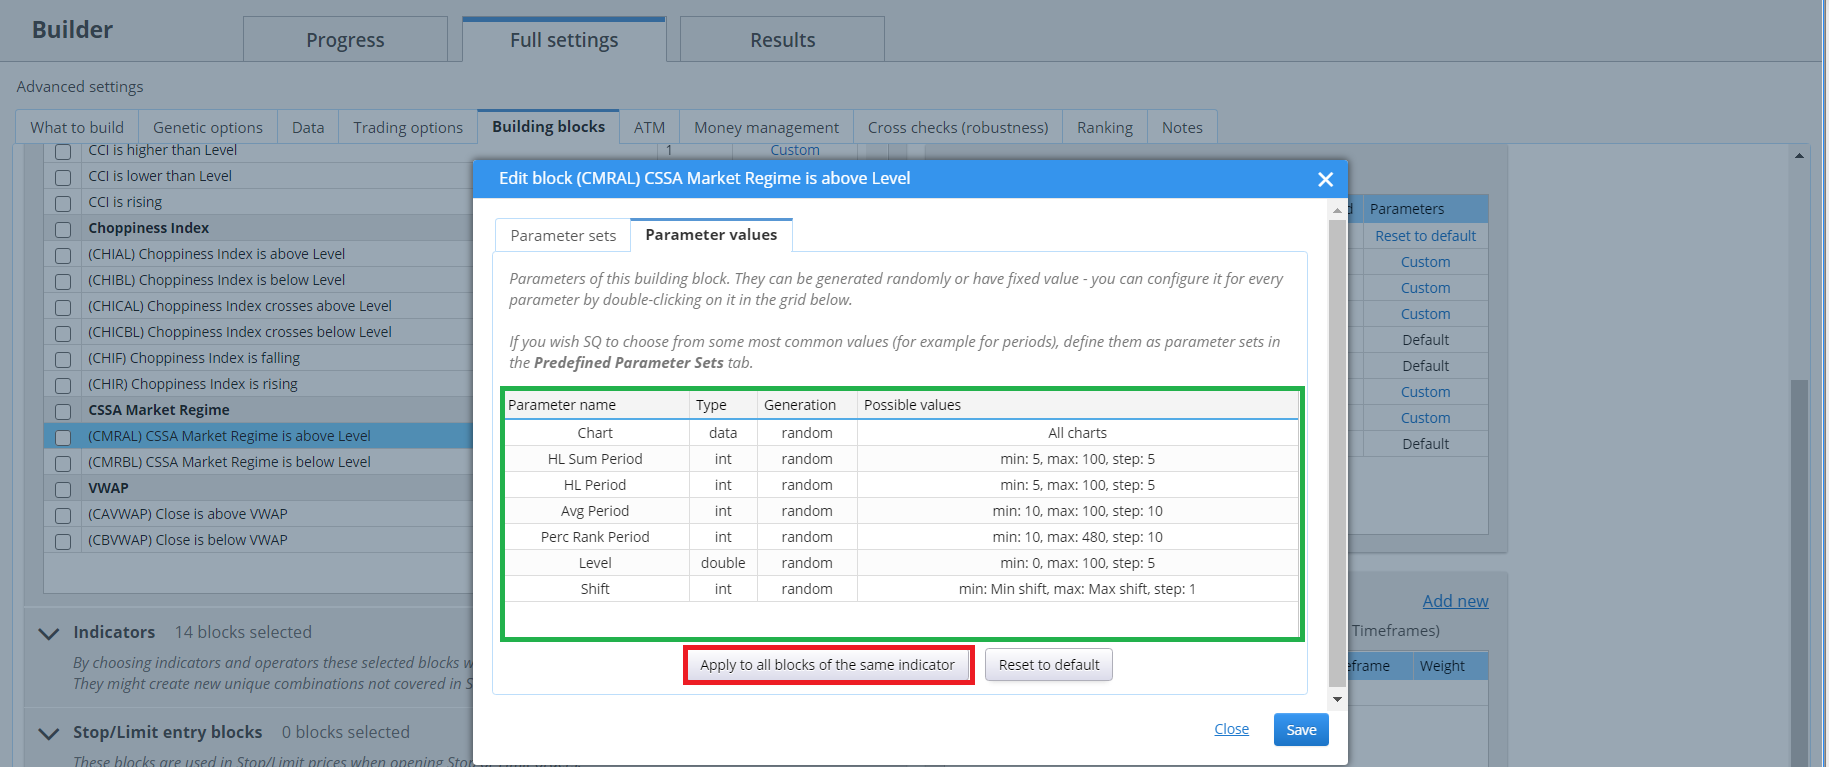
CSSA Market Regime
An indicator whose ideological author is David Varadi, the person behind the phenomenal CSSA blog. The goal of the algorithm is to quantify when markets are stable – that is, predictable – and when it is therefore advisable to use strategies. For a better understanding of the concept, I recommend reading directly from the CSSA website here .
When the CSSA Market value is above 0.5, it indicates that the market is in a “chaos” regime and is much less predictable and non-stationary, values below 0.5 indicate that the market is stable and much more predictable.
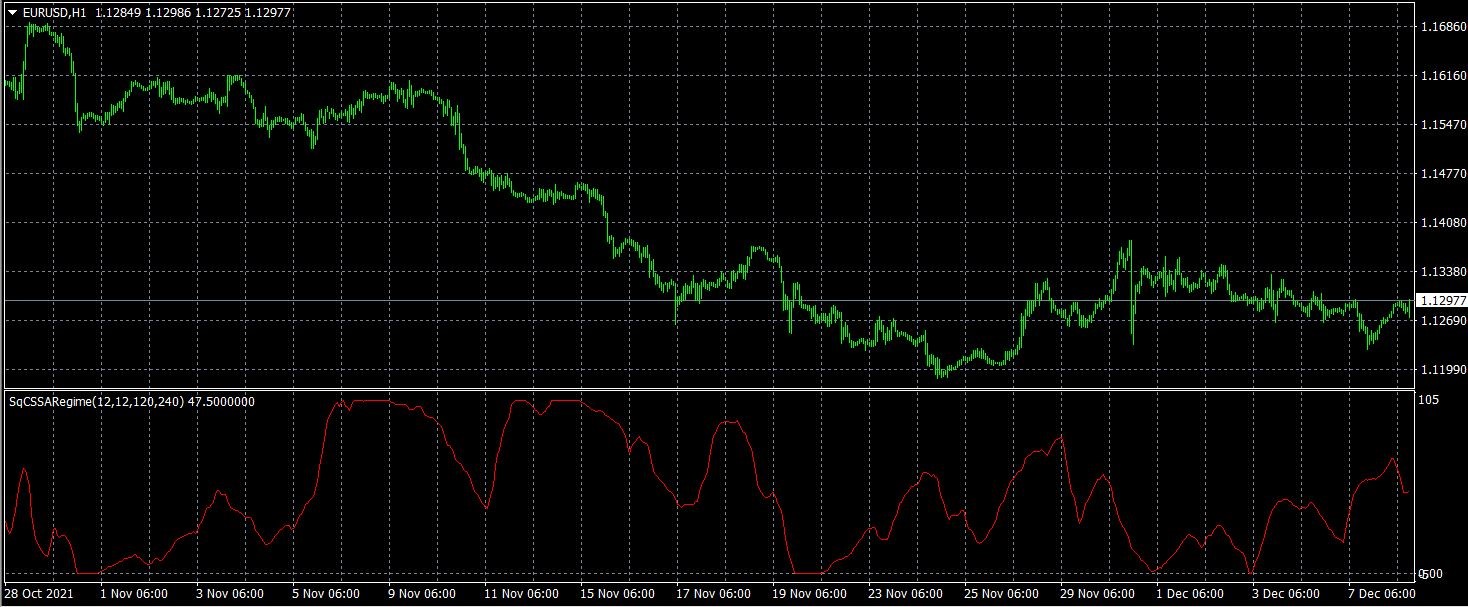
The indicator has 4 parameters:
- HLSumPeriod
- HLPeriod
- AvgPeriod
- PercRankPeriod
I would like to highlight the fact that the indicator has 4 parameters that can be optimized. Before using the indicator, you should visualize it in the trading platform and reduce the range of possible steps for each parameter. I personally recommend minimizing at least two parameters
We have added these basic conditions:
- CSSA Market Regime Above/Below level
The indicator is implemented in MetaTrader 4, MetaTrader 5, Tradestation, and Multicharts.
You can download the indicator and conditions here.
Entropy Math
Entropy is a measure of disorder, a term used for the most part in physics. In simple words: the level of entropy is determined by the degree of uniformity of the distribution of something (for example, matter) in space. The concept of entropy is associated with chaos, where there are billions of possible variations. But this does not mean at all that it is impossible to find a pattern in it. The starry sky can be called high entropy, but nevertheless, there are constellations in it. The Entropy Math indicator looks for patterns based on which trading strategy is built.
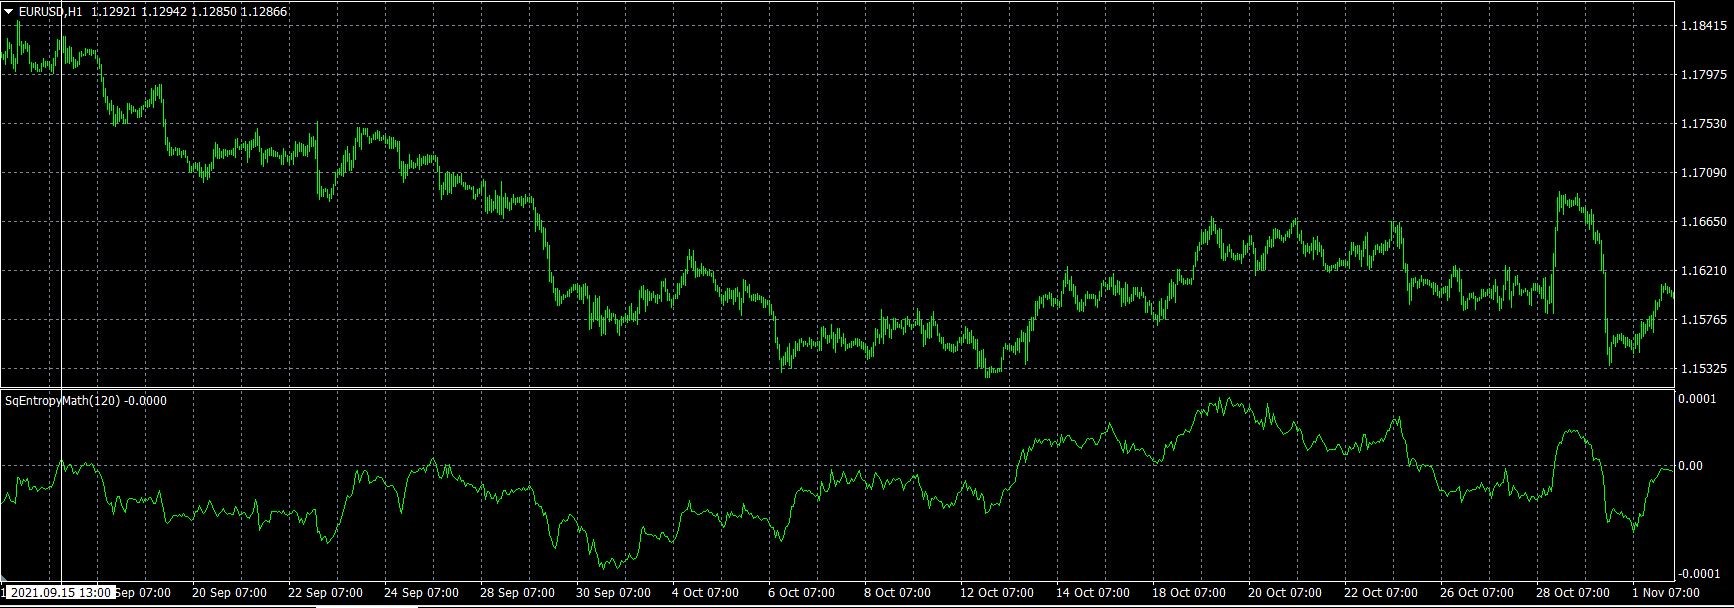
The indicator oscillates around the value of 0. If it is below the value 0 -+ value it means that the market is in trend, if it is between the value 0 -+ value it is in a chaos regime.
The indicator has one parameter:
We have added these basic conditions:
- EntropyMath is above/below Level
- EntropyMath crosses above/below Level
The indicator is implemented in MetaTrader 4, MetaTrader 5, Tradestation, and Multicharts.
You can download the indicator and conditions here.
Choppiness Index
The Choppiness Index (CHOP) is an indicator you can use to determine if the market is choppy (trending sideways) or not choppy (trading within a trend in either direction). The Choppiness Index is the indicator that is not directional at all. CHOP is not designed to predict future market direction, but is only used to determine the trend of the market. Indicator values are ranging between 0 – 100. A basic understanding of the indicator would be as follows: Higher values mean more choppiness, while lower values indicate a directional trend.
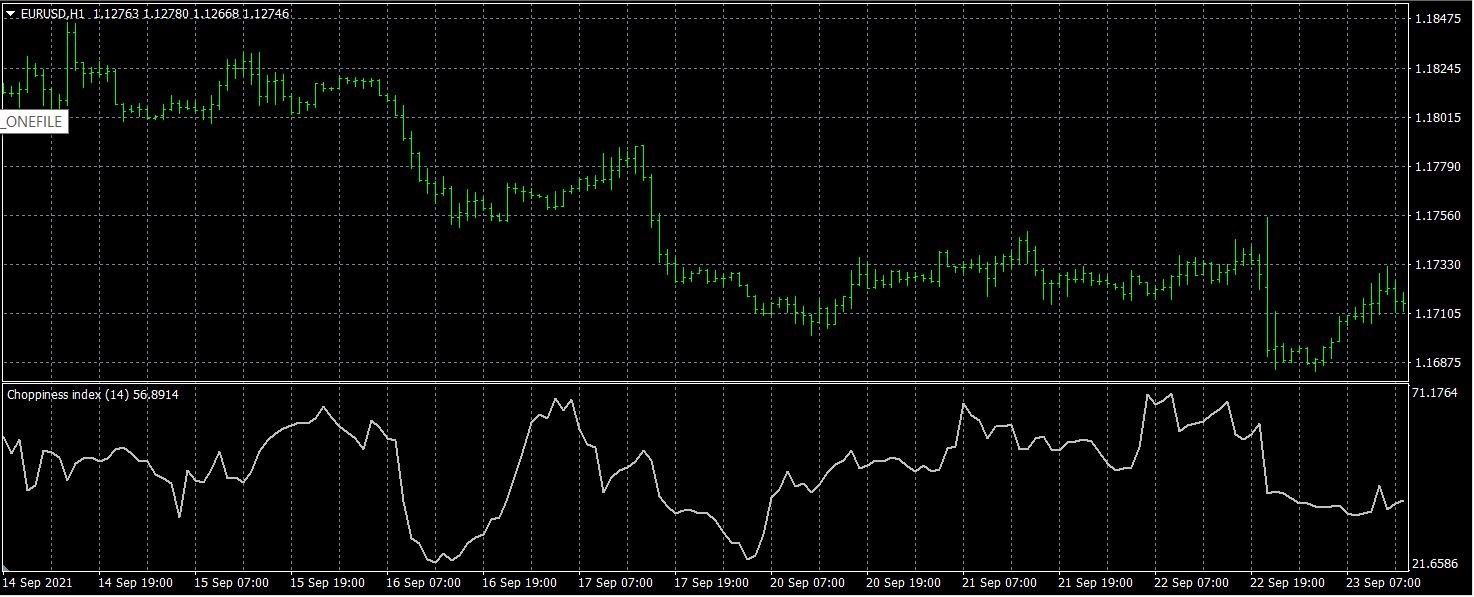
The indicator has one parameter:
We have added these basic conditions:
- Choppiness Index is above/below Level
- Choppiness Index crosses above/below Level
- Choppiness Index is rising/falling
The indicator is implemented in MetaTrader 4, MetaTrader 5, Tradestation, and Multicharts.
You can download the indicator and conditions here.
Detrended Price Oscillator (DPO)
Unlike other oscillators, such as the Stochastic or the MACD (Moving Average Convergence Divergence), the DPO is not a momentum indicator. Instead, it highlights peaks and troughs in prices that are used to estimate buy and sell points in line with the historical cycle. The Detrended Price Oscillator is designed to help a trader identify the price cycle of an asset. It does this by comparing SMA to a historical price that is near the midpoint of the look-back period.
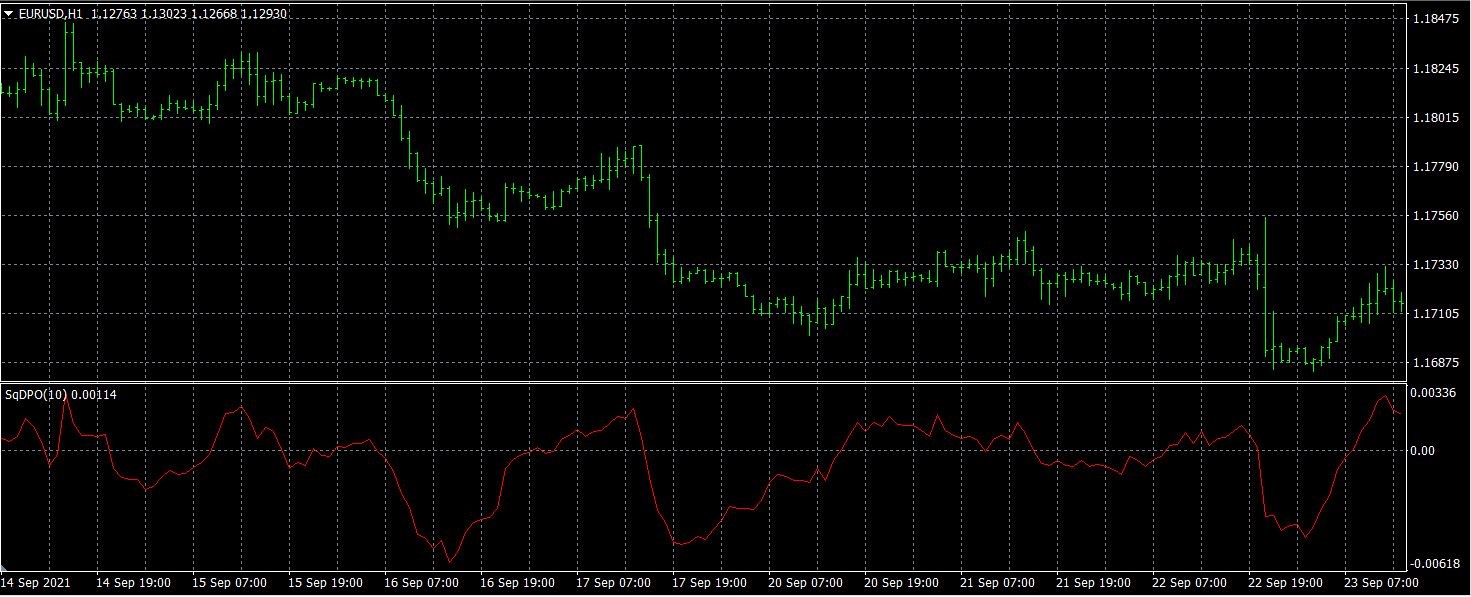
The indicator oscillates around/below the value 0.
The indicator has one parameter:
We have added these conditions:
- DPO is above/below level
- DPO crosses above/below level
The indicator is implemented in MetaTrader 4, MetaTrader 5, Tradestation, and Multicharts.
You can download the indicator and conditions here.


This is Excellent !!!!!! ???
Thank you very much Clonex for your awesome work !!!!!!!!!!!!!!!!!!!!!!!!!!!!
This is helping a lot !!!!