


 Spanish
 Portuguese
 French
 Italian
 German
 Japanese
AI News Impact Analyzer
Page contents
What Is It?
The AI News Impact Analyzer is a Results Plugin for StrategyQuant X that uses artificial intelligence to analyze the impact of major economic news events on every single trade in your strategy — then lets you filter those trades out of the equity curve to see how much your strategy improves.
Select any strategy in a databank, click Analyze, and the AI will cross-reference each trade’s open date/time with central bank decisions, economic data releases, geopolitical events, and market-moving news. For each trade, it determines whether a scheduled news event likely caused a positive or negative impact — then gives you one-click filters to remove those event-affected trades from your equity curve.
The result? You can instantly see what your strategy looks like without FOMC days. Without NFP releases. Without BOJ surprises. And you can measure exactly how much each news category costs (or benefits) your strategy — with full statistics, walk-forward validation, and overfitting safeguards built in.
Why You Need This
News Events Destroy Strategies — Now You Can See Which Ones
Most algorithmic strategies are tested across years of data that include dozens of FOMC meetings, hundreds of NFP releases, central bank interventions, elections, and geopolitical shocks. These events create abnormal volatility that can distort your strategy’s performance — both in backtesting and in live trading.
The AI News Impact Analyzer lets you isolate and quantify the damage (or benefit) of each event category so you can make data-driven decisions about whether to add news filters to your live strategy.
Data-Driven Filter Recommendations
Stop guessing which news events to avoid. The AI analyzes all your trades, identifies patterns, and generates specific, actionable recommendations — for example:
“FOMC announcements caused 8 negative trades totaling -180 — not significant enough to filter.”
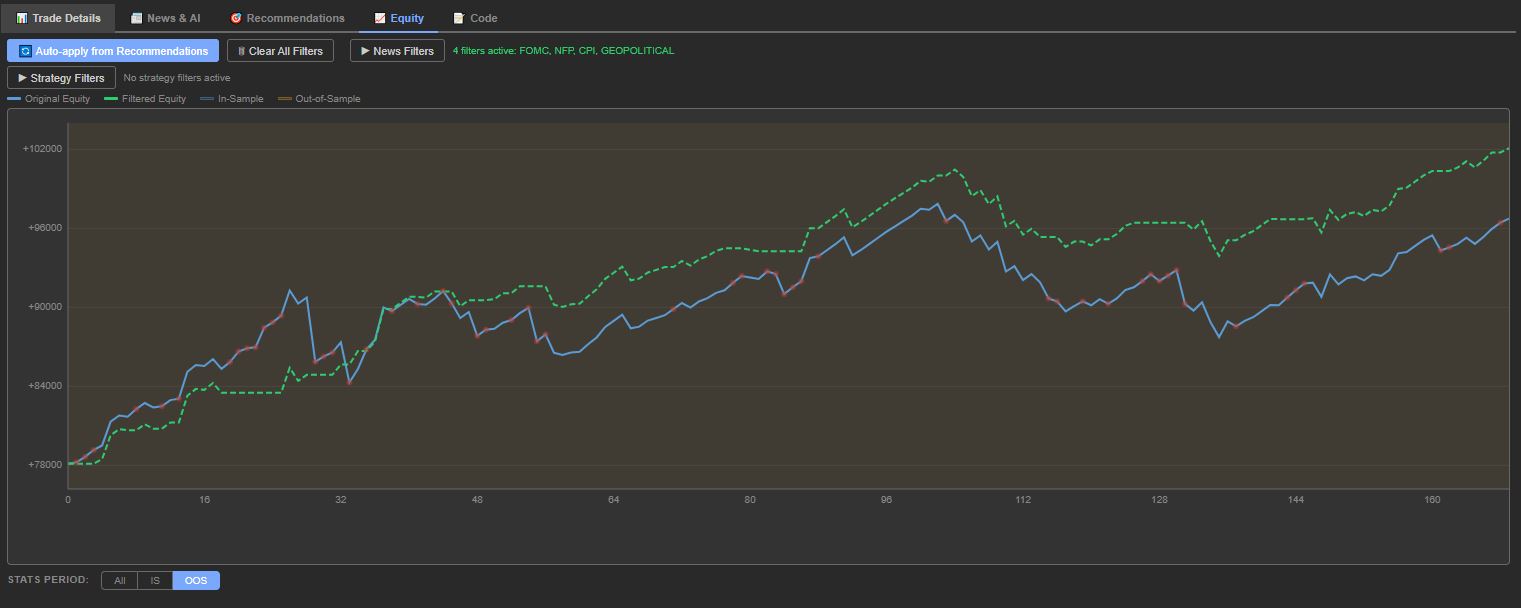
Instant Visual Feedback with Equity Chart
Every filter you check or uncheck immediately redraws the equity curve. Two lines — original vs. filtered — let you see at a glance:
- How much total P/L improves
- Whether drawdown decreases
- If the win rate changes
- Whether profit factor improves
Full statistics (Total P/L, Max Drawdown, Trades, Win Rate, Profit Factor, Avg Trade) update in real time with percentage deltas so you know exactly how much each filter contributes.
Walk-Forward Validation (IS/OOS Awareness)
This isn’t just curve fitting. The plugin is built with overfitting prevention at its core:
- Every trade is labeled [IS] In-Sample or [OOS] Out-of-Sample based on your SQX walk-forward settings
- The equity chart shows IS and OOS periods with distinct blue and orange background bands
- The Stats Period selector (All / IS / OOS) lets you view statistics and the equity chart for each period independently
- IS-only Recommendations mode generates filter suggestions using only In-Sample data — then you switch to OOS to validate whether those filters also improve the out-of-sample period
- Blind OOS Analysis hides P/L data from the AI when analyzing OOS trades, preventing outcome bias
Built-In Overfit Risk Indicator
Every time you apply filters, the plugin calculates an Overfit Risk score (Low / Medium / High) based on:
- How many filters are active
- What percentage of trades are being removed
- Whether you’re using “hindsight” filters (like “All Negative”)
This gives you an honest reality check: are you discovering a genuine edge, or just overfitting the backtest?
Auto-Apply Recommendations
After the AI generates recommendations, one click on “🔄 Auto-apply from Recommendations” parses the AI’s text and automatically checks the matching news filters and strategy filters — saving you from manually reading through the analysis.
How It Works
Step 1 — Select a Strategy
Click on any strategy in a StrategyQuant X databank. The plugin automatically loads all trades from the selected strategy into the trade list panel.

Step 2 — Configure Analysis Scope
Fine-tune what the AI analyzes using the config bar:
| Setting | What It Controls |
| Result | Portfolio / Main / Walkforward results |
| Sample | Full / In-Sample / Out-of-Sample |
| Scope | All Trades, Winners Only, Losers Only |
| News Window | Time window around each trade to search for news (±2h, ±4h, ±8h, ±24h, ±48h) |
| Include Strategy Code | Sends the strategy’s source code to the AI for deeper context |
| Batch Size | 1, 5, 10, 20, 50, or 100 trades per API call (higher = faster + cheaper) |
Step 3 — Analyze
Click Analyze and the AI processes every trade in batches:
- For each trade, it examines the open date, time, symbol, direction, and P/L
- It cross-references against its knowledge of scheduled economic events (FOMC, ECB, BOJ, NFP, CPI, GDP, etc.)
- It classifies each trade’s news context as POSITIVE, NEGATIVE, or NEUTRAL impact
- It tags each trade with the specific news categories that were active (e.g., FOMC, GDP)
Progress updates in real time. You can stop the analysis at any time and work with partial results.
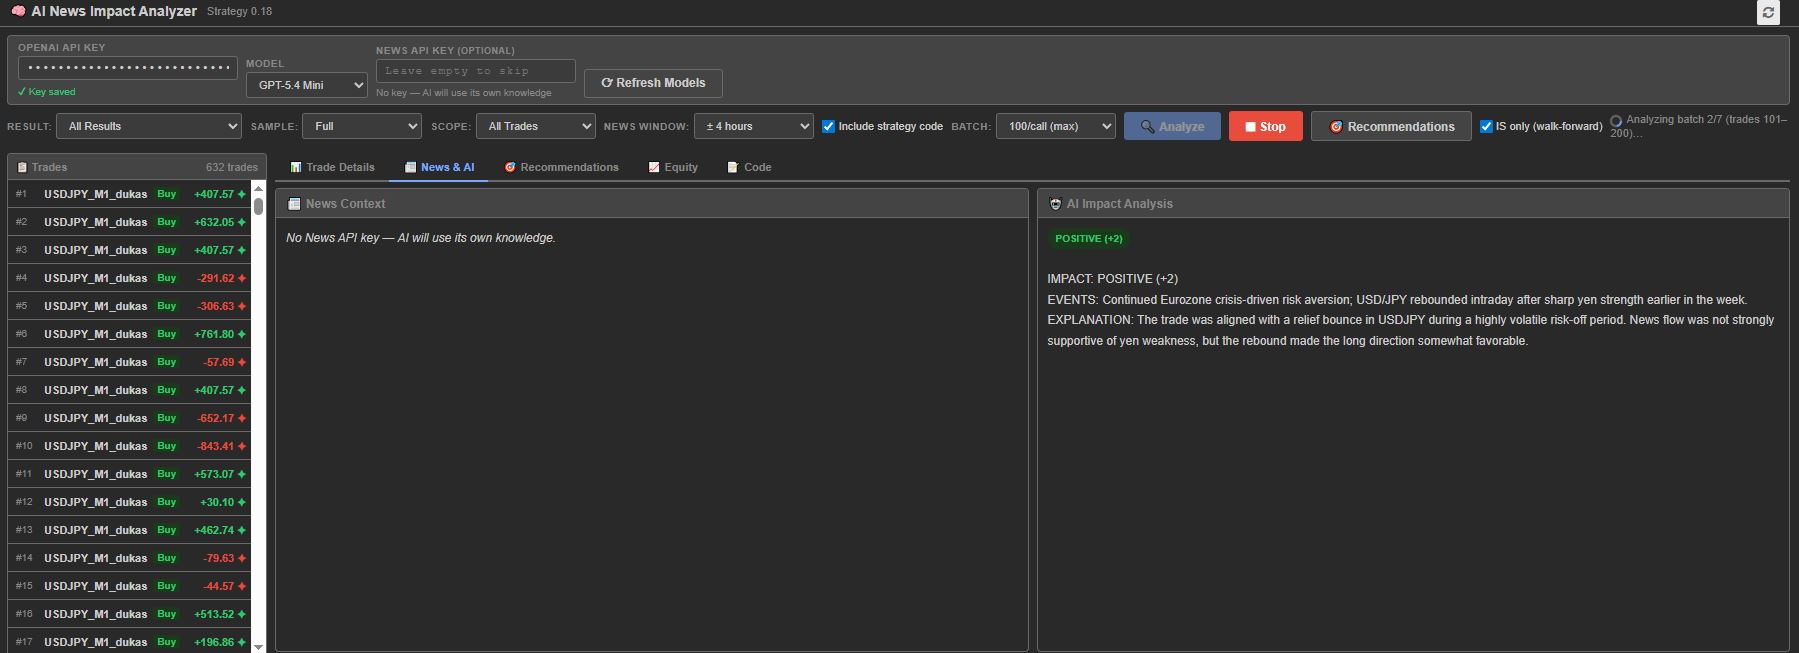
Step 4 — Review Trade-by-Trade Analysis
Switch to the News & AI tab to see each trade’s analysis:
- Which news events were happening around the trade
- Whether the impact was positive, negative, or neutral
- The AI’s confidence and reasoning
- [IS] or [OOS] period labels
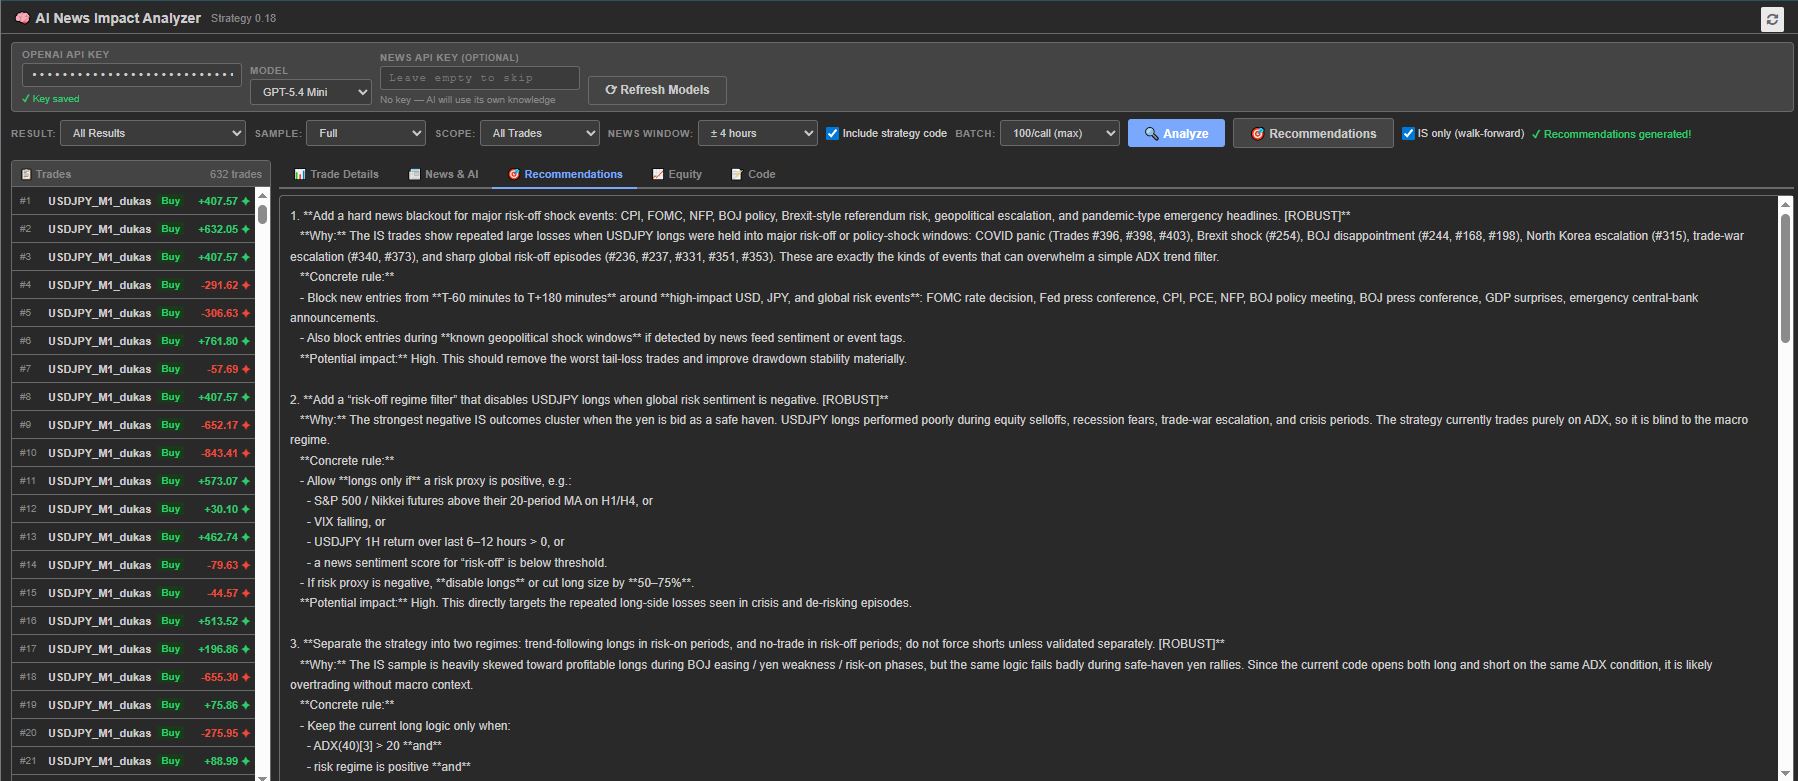
Step 5 — Get Recommendations
Click Recommendations to get AI-generated filter suggestions. The AI:
- Summarizes which event categories are most harmful to the strategy
- Recommends specific filters to apply
- Suggests time-based and day-of-week patterns
- Provides technical indicator suggestions for implementation in live trading
Walk-Forward Mode (IS Only ✅): When checked (default), recommendations are based exclusively on In-Sample trades. This means the AI has never seen the OOS results — giving you a truly blind forward test when you validate on OOS.
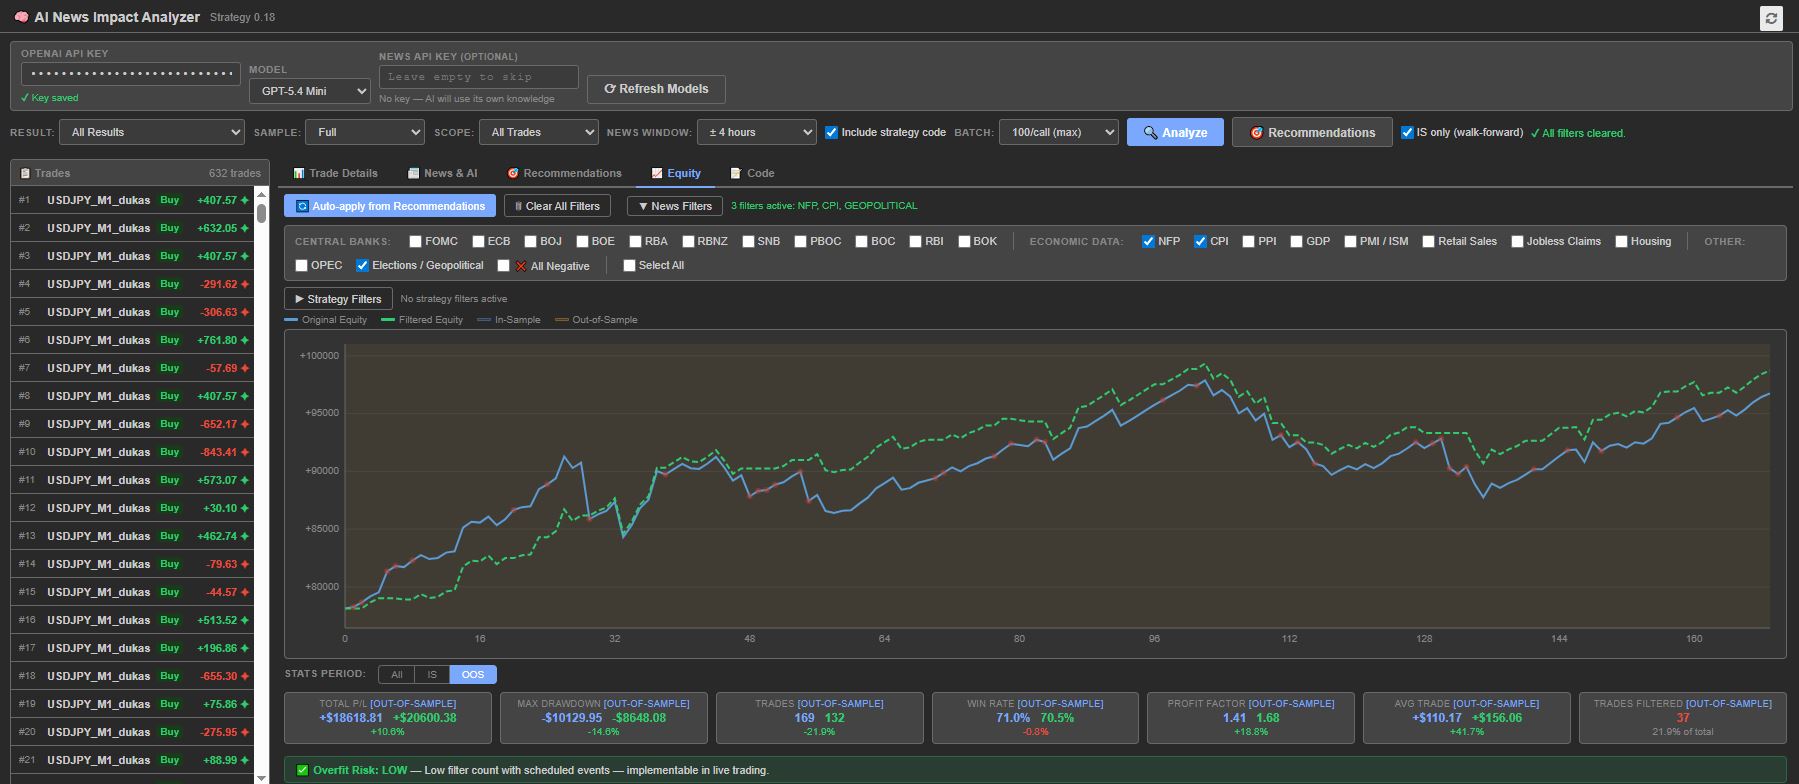
Step 6 — Apply Filters & Analyze the Equity Chart
Switch to the Equity tab and start experimenting:
News Filters — Check any combination of event categories:
- Central Banks: FOMC, ECB, BOJ, BOE, RBA, RBNZ, SNB
- Economic Data: NFP, CPI, PPI, GDP, PMI/ISM, Retail Sales, Jobless Claims, Housing
- Other: OPEC, Elections/Geopolitical
- Special: All Negative (removes all AI-flagged negative trades), Select All
Strategy Filters — Fine-tune further:
- Direction: Skip Long trades, Skip Short trades
- Day of Week: Skip specific days (Mon-Sun)
- Hour Range: Skip trades opened during specific hours
- Sessions: Quick-select Asian, London, or New York sessions
Every filter change instantly redraws the chart with two equity curves:
- 🔵 Original Equity — the unfiltered strategy
- 🟢 Filtered Equity (dashed) — the strategy with filtered trades removed
- 🔴 Red dots mark filtered-out trades on the original curve
Statistics Cards update simultaneously showing:
- Total P/L (original vs. filtered, with % delta)
- Max Drawdown
- Trade count
- Win Rate
- Profit Factor
- Average Trade
- Trades Filtered (count and %)
Step 7 — Validate with IS/OOS Period Selector
Use the Stats Period buttons below the chart:
| Button | What It Shows |
| All | Full equity curve and stats for all trades |
| IS | Chart and stats for In-Sample trades only (blue background) |
| OOS | Chart and stats for Out-of-Sample trades only (orange background) — both curves start at the same value for clear comparison |
This is your walk-forward validation loop:
- Generate recommendations from IS data only ✅
- Auto-apply the recommended filters
- Check IS stats → filters should improve IS performance (expected)
- Switch to OOS → if filters also improve OOS, you have a genuine edge
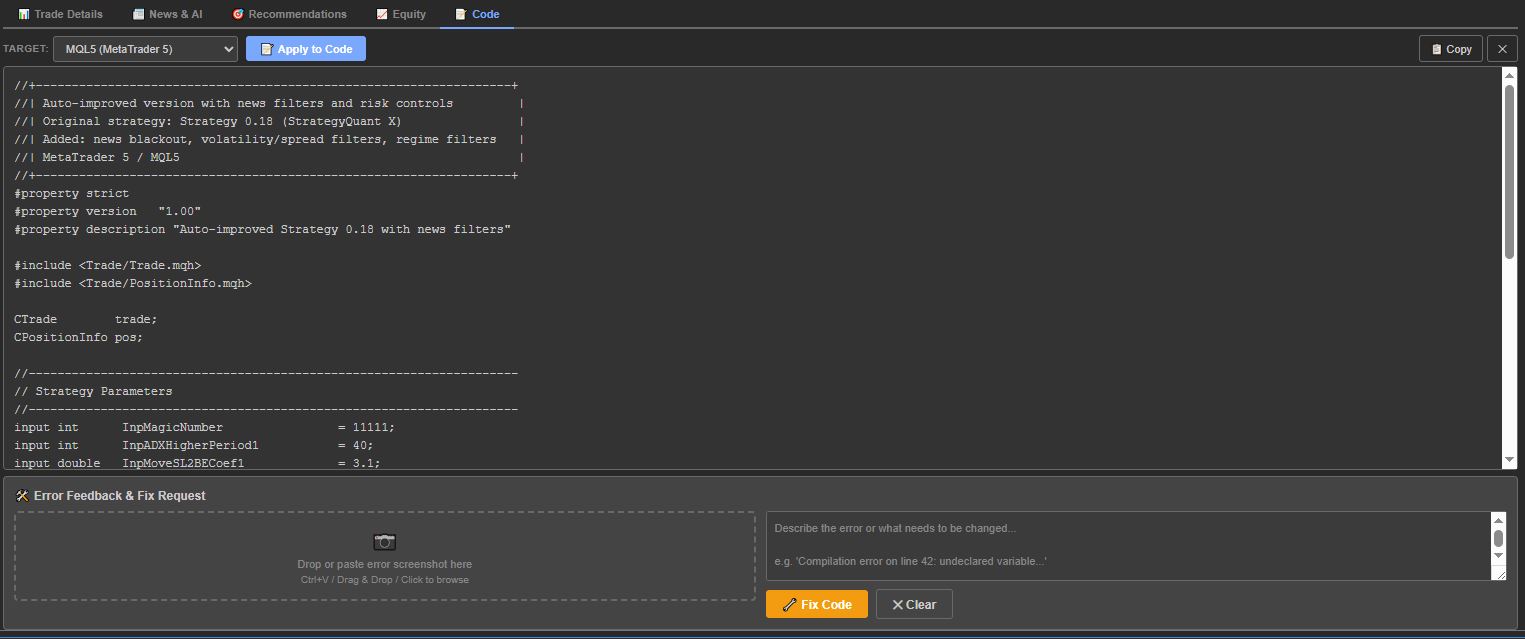
Step 8 — Generate Filtered Code
Switch to the Code tab. The plugin can translate your strategy into target platform code with the recommended filters already baked into the source code — so you can deploy a news-filtered version directly to your trading platform.
Key Features at a Glance
| Feature | Description |
| AI News Analysis | Cross-references every trade with major economic events using OpenAI |
| 14 News Categories | Central banks (7), economic data (7), plus OPEC and geopolitical events |
| Real-Time Equity Chart | Interactive canvas chart with original vs. filtered equity curves |
| IS/OOS Awareness | Blue (IS) and orange (OOS) background bands, blind OOS analysis |
| Period Selector | View chart and stats for All, IS, or OOS trades independently |
| Walk-Forward Validation | IS-only recommendations mode for blind OOS forward testing |
| Strategy Filters | Day-of-week, hour range, session, and Long/Short direction filters |
| Overfit Risk Score | Automatic Low/Medium/High risk warning based on filter count and type |
| Auto-Apply | One-click to parse AI recommendations and check matching filters |
| Batch Processing | 1 to 100 trades per API call — analyze 600+ trades in minutes |
| Trade List with OOS Markers | Orange background on OOS trades for instant visual identification |
| Filter Tooltips | Hover over any filter checkbox to see a description of what it does |
| Avg Trade Statistic | See the average trade value for both original and filtered equity |
| Model Selection | GPT-4o, GPT-4.1, GPT-5.4, o3-mini, o4-mini and more |
| News API Integration | Optional NewsAPI key for real-time news data (AI uses its own knowledge if no key) |
| Dark Theme | Optimized for SQX dark skin |
| Zero Dependencies | Two files (index.html + app.js), no build step, no libraries |
Installation
- Download the plugin folder (AI News Impact Analyzer)
- import it using the Code Editor
- Compile
- Restart StrategyQuant X (or reload the Results tab)
- The plugin appears as a new tab: AI News Impact Analyzer in the Results panel
- Enter your OpenAI API key on first use — it will be remembered for future sessions
Note: You need a StrategyQuant X Pro or Ultimate license to use custom Results Plugins. The Starter license does not support plugin extensions.
FAQ
Q: Do I need an OpenAI account?
A: Yes. You need an OpenAI API key (starts with sk-proj-…). Create one at platform.openai.com. API usage is pay-per-use — analyzing a 300-trade strategy typically costs $0.05–0.50 depending on the model and batch size.
Q: Which model should I use?
A: GPT-5.4 Mini offers the best balance of speed, quality, and cost. For cheaper analysis, use GPT-4.1 Mini or GPT-4o Mini. For maximum accuracy on complex strategies, try GPT-5.4 or GPT-4.1.
Q: What batch size should I use?
A: 50/call or 100/call is fastest and cheapest (fewer API calls = lower cost). Use 10/call for more detailed per-trade analysis. Use 1/call only when you want the most thorough analysis of individual trades.
Q: Do I need a NewsAPI key?
A: No. The NewsAPI key is optional. Without it, the AI uses its built-in knowledge of major economic events (FOMC dates, NFP schedules, etc.) which is sufficient for most analyses. A NewsAPI key adds real-time news headlines for more specific context.
Q: How does the “IS only” mode prevent overfitting?
A: When checked, the Recommendations button sends only In-Sample trades to the AI. The AI generates filter suggestions without ever seeing OOS data. You then apply those filters and check OOS performance separately — if OOS also improves, the filters are likely capturing a real edge rather than fitting to noise.
Q: What does “Blind OOS Analysis” mean?
A: When analyzing OOS trades, the AI does not see the P/L or close price. It only sees the open time, symbol, direction, and open price. This prevents the AI from using hindsight (“this trade lost money, so the news must have been bad”) and forces it to make a genuine assessment of whether news events were likely to cause market disruption.
Q: Is the “All Negative” filter useful?
A: Use it with caution! The “All Negative” filter removes all trades the AI flagged as negatively impacted by news — but this uses hindsight (the AI saw the P/L). The Overfit Risk indicator will flag this as HIGH risk. It’s useful for understanding the theoretical best case, but you cannot replicate this in live trading because you won’t know which trades will be negative in advance.
Q: Can I use this with walk-forward optimization in SQX?
A: Absolutely — that’s the intended workflow. SQX marks trades with IS/OOS sample types during walk-forward optimization. The plugin reads these labels and uses them throughout: IS/OOS background bands on the chart, period selector for stats, IS-only recommendations, and blind OOS analysis.
Q: Is my API key secure?
A: Your API key is stored in your browser’s localStorage and is sent only to the OpenAI API endpoint (api.openai.com). It is never transmitted to StrategyQuant or any third party.
Watch the video below for more details.
