


 Spanish
 Portuguese
 French
 Italian
 German
 Japanese
How would you interpret this result?
13 replies

lemming78
11 years ago #113708
Hello guys, how would you interpret this result? Seems a little bit odd.. Does that mean that all the unluck has been in place in the last 4 years?
Thanks
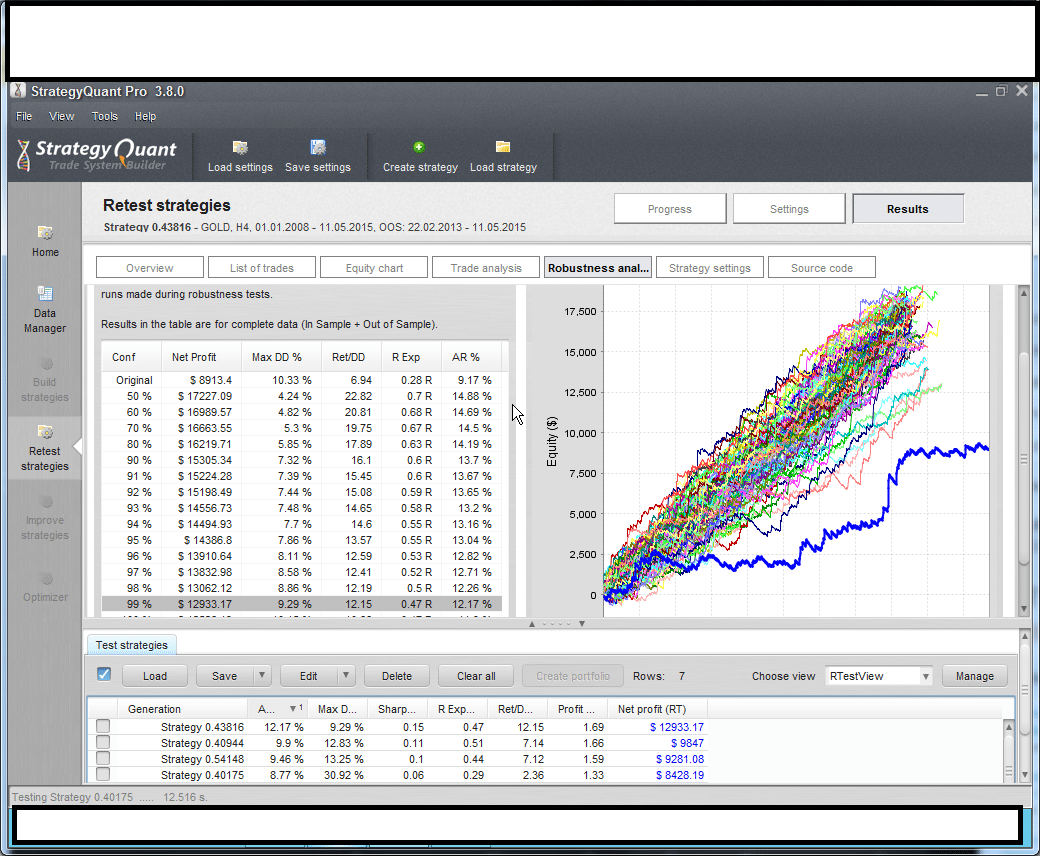 Immagine.png
0

mikeyc
11 years ago #130432
That’s how I would read it, good strategy faced with bad luck.
0
lemming78
11 years ago #130433
Ok man, i have tons of these… but a wf analysis won’t be accurate so i just should put them in my portfolio? Isn’t there any way in sq to do a montecarlo analysis on a portfolio? Only in pro ea analyzer right?
0
mikeyc
11 years ago #130434
SQ can’t do a montecarlo on a portfolio I don’t think.
I’ve never seen the main strategy be an outlier like that, maybe there’s something weird going on with these strategies. Perhaps some others here have a view on this?
0

Mark Fric
11 years ago #130441
it is hard to say what is the reason for this without seeing your exact strategy and MC settings.
it looks like either the original strategy was extremely curve fitted, or there is some strange issue with monte carlo tests.
If you can attach your strategy here I could have a look at it.
Mark
StrategyQuant architect
0
lemming78
11 years ago #130445
it is hard to say what is the reason for this without seeing your exact strategy and MC settings.
it looks like either the original strategy was extremely curve fitted, or there is some strange issue with monte carlo tests.
If you can attach your strategy here I could have a look at it.
I can’t upload here because it’s over 2mb:(
here you go anyway
thanks
data from duka 4h.
0
Mark Fric
11 years ago #130476
it is asking me for some decryption key when I want to download it
Mark
StrategyQuant architect
0
lemming78
11 years ago #130482
it is asking me for some decryption key when I want to download it
Don t know why. here you go btw
thanks
https://www.sendspace.com/file/gwun99
0

geektrader
11 years ago #130486
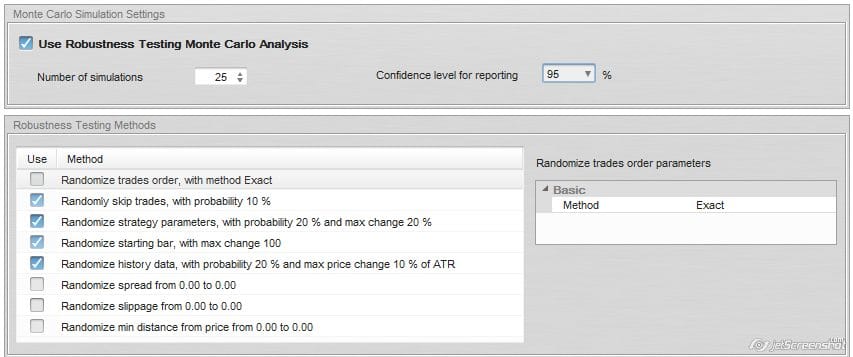
If the main strategy is an outlier like that it´s usually a “wrong” setting in the Robustness Test. Most often it´s the “randomize price” test which works only in selected time frame only method, even if you are testing with tick simulation. Let us know your robustness test settings and I am sure we´ll find out what the problem is.

0

nolube
11 years ago #130488
it is hard to say what is the reason for this without seeing your exact strategy and MC settings.
it looks like either the original strategy was extremely curve fitted, or there is some strange issue with monte carlo tests.
If you can attach your strategy here I could have a look at it.
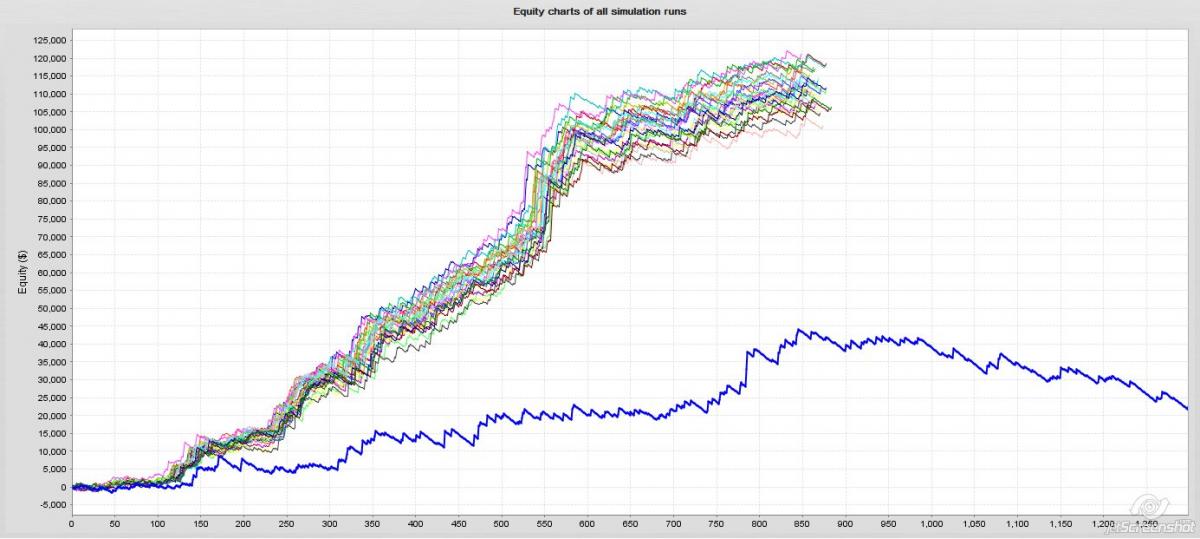
Initially that graph would have said to me that the strategy is likely to perform better in real world conditions than in the original strategy test.. ?? But that just doesn’t make sense.. 🙁
I have a tonne of these as well, which also happen to be on Gold, but D1.
These are my settings, and RT chart.
 mcanalysis.jpg
 goldRT.jpg
0
geektrader
11 years ago #130489
Uncheck the “randomize history data”, it leads to false results as I mentioned above as it only tests in “selected time frame precision mode” but you are most likely using “tick simulation mode” for your backtests. So that won´t go together and create strange results. I already opened a ticket about this a while ago, not sure if Mark looked at it. Anyhow, if you uncheck that test, everything will look fine, right?
0
nolube
11 years ago #130490
Oh History data, thanks I will give it a go.. Didn’t click that was the one when you said price.
0
geektrader
11 years ago #130492
DIdn´t know the exact wording in SQ by that time as I was on the road, but price/history is the same actually, as history consists of prices of the security:)
0
lemming78
11 years ago #130494
It worked… 5 strategies in bin now:D
0
Viewing 13 replies - 1 through 13 (of 13 total)