Introduction
Robustness testing is an important component of StrategyQuant X tools that help users evaluate the stability, reliability, and adaptability of their trading strategies under various market conditions and potential uncertainties. .
The main objective of robustness testing is to evaluate the performance of a trading strategy under different market conditions, scenarios, and parameter settings.
StrategyQuant contains several specific tools for evaluating the robustness of strategies. In this paper we analyze the effectiveness of selected tools. This evaluation ensures that the strategy is not over-optimized for a given data and can adapt to changing market conditions, thereby increasing the probability of successful trading performance.
An example of a robust and non-robust strategy
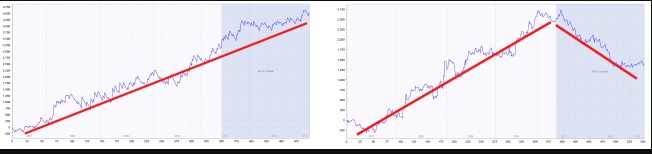
The blue part of each chart is the out of sample (unknown) data., We can see that the strategy on the left performs well also on this part, while strategy on the right fails on the unknown data – it is almost certain to be curve fitted.jasne
Goal of the research
The objective of the study is to examine the effectiveness of various types of robustness tests in StrategyQuant X in.
The outcomes of this study should address the following key points:
- Performance Comparison: compare the performance of trading strategies that have undergone different robustness tests in StrategyQuant X, highlighting the effectiveness of each test in identifying robust strategies.
- Overfitting Prevention: measure the effectiveness of each robustness test in minimizing overfitting, ensuring that strategies perform well on both in sample and out of sample data.
- Real Trading Performance: investigate the correlation between strategies that pass each robustness test and their actual performance in live trading environments, providing insights into the practical value of these tests.
- Adaptability to Market Changes: evaluate the ability of each robustness test to identify trading strategies that can adapt to changing market conditions and maintain their performance over time.
- Recommendations for Test Combinations: provide recommendations for the optimal combination of robustness tests to maximize the identification of resilient and adaptable trading strategies while maintaining efficiency and practicality.
In conclusion, the study should thoroughly evaluate the effectiveness of various types of robustness tests in StrategyQuant X and provide insights into their strengths, weaknesses, and practical applications.
The results will help traders and investors better understand the value of each test and make informed decisions when developing and validating their trading
Results
The result of the analysis is the finding that the most effective test of robustness under the chosen settings appears to be testing the strategy on multiple markets. By testing strategy on multiple markets, we mean selecting strategies according to the highest average values of the given strategy metrics on multiple markets. On average, they improve the performance of the strategy by 14%. In StrategyQuant it is very easy to test the robustness of a strategy on multiple markets using the Test on Additional Markets crosscheck.
Second best robustness check is the Monte Carlo Randomization of historical data. On the following pages you can read the detailed results of our analysis and the methodology we used in the analysis. The analysis is designed to be useful for users of the StrategyQuant X program.
You can read more about all the robustness tests in Strategy Quant X in our documentation
In the analysis, we used the following settings and types of robustness tests:
Please note that this result is valid only for given build and test configuration that you can see below – forex, 4H timeframe, given set of symbols and given exact build settings.
It is a work for the future – which we plan to do as continuation of this series – to verify if this result holds also for other assets, other timeframes and other build configurations.
Introduction to the analysis
In the following part, I prepared a study for you that I worked on for 2 months. I developed dozens of pages of Python code for it. It is a big project where you have to work with huge datasets, perform numerical operations, analyze the data and interpret it later. The goal was to figure out how a particular robustness test can help select strategies that are more likely to produce robust results in the future. The paper follows the logic of the procedure in the analysis.
First, we load 5 datasets with general rankings of stick strategies for each robustness test. By dataset we mean 100 000 strategies selected based on a very general ranking.
I will repeat this procedure in different time periods
- 2003 – 2017 + 2 Years True Out Of Sample ( 1.1.2017 – 31.12.2018)
- 2004 – 2018 + 2 Years True Out Of Sample ( 1.1.2018 – 31.12.2019)
- 2005 – 2019 + 2 Years True Out Of Sample ( 1.1.2019 – 31.12.2020)
- 2006 – 2020 + 2 Years True Out Of Sample ( 1.1.2020 – 31.12.2021)
- 2007 – 2021 + 2 Years True Out Of Sample ( 1.1.2021 – 31.12.2022)
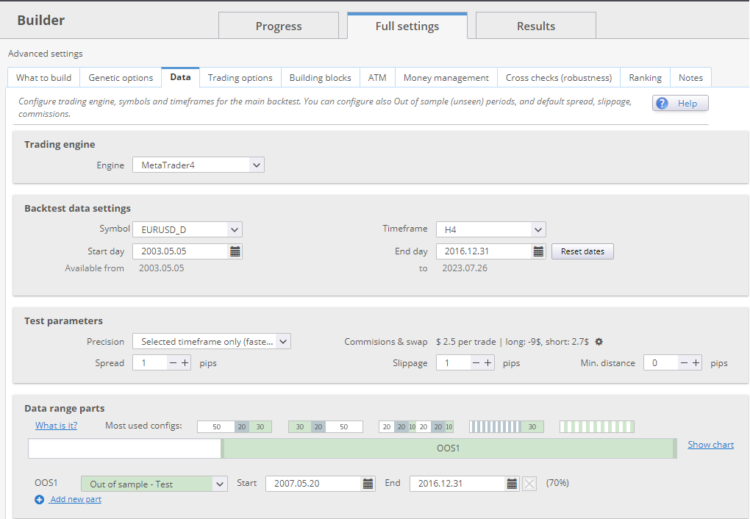
Each dataset had a setting of IS = 30% and OOS 70%, true out of sample was 2 years.
Example on the picture below: Dataset 2003-2017 ends 31.12.2016 and has true out of sample period of 2 years from 1.1.2017- 31.12.2018.
In other words, we will simulate the generation of strategies with the end of generation in 2017, 2018, 2019, 2020, 2021. After each time window, the strategies will follow in the so-called true out of sample. ( + 2 years )
First, we generate datasets without robustness tests and then apply selected tests on out of sample periods to each dataset.
For each out of sample period, I select the strategies in the top 1% of values with the given robustness test strategy metric , find the performance of these strategies in the out of sample period, and compare their performance to all strategies in the out of sample period. I get the data for each time period and then know how a given robustness check would help on average
At the end of the article you will find a table where I described which tests work best… and vice versa, which I have by no means confirmed. You can use this table when creating your own strategy. Tests that have been confirmed should definitely be included in your workflow.
Let’s begin…
Builder settings and dataset description
Datasets
First, we generate 5 datasets. By dataset we mean 100 000 strategies selected based on a very general ranking.
I filtered the strategies generated by SQX based on these basic criteria:
I will repeat this procedure in different time periods
- 2003 – 2017 + 2 Years True Out Of Sample
- 2004 – 2018 + 2 Years True Out Of Sample
- 2005 – 2019 + 2 Years True Out Of Sample
- 2006 – 2020 + 2 Years True Out Of Sample
- 2007 – 2021 + 2 Years True Out Of Sample
Each dataset had a setting of IS = 30% and OOS 70%, true out of sample was 2 years.
Builder config – strategy type setting
I have generated a simple type of strategies for a 4-hour time frame. Strategy could only enter by Enter At market. I set both stop loss and profit target on an ATR basis. I used only built-in integrated indicators and only conditions. Strategies strategies could have a maximum of two entry conditions..
We chose the 4-hour time frame, but my experience is that individual time frames, markets, and setups can have their idiosyncrasies, so it is not possible to draw general conclusions after a single analysis. The goal of the study was to show trends when using robustness tests in order to prepare the workflow for further analysis and to raise questions for discussion.
Creating and cleaning such a large dataset (5* 100 000) takes a lot of time and effort. I created the strategies on 2 AMD Threadripper 2950 workstations with 32 processors. It took about 12 days to create the strategy with a custom project.
Spreads, Swaps are set according to Darwinex broker, all spreads are increased by 0.5 pip or rounded up. For each trade a commission of 2.2 USD was charged.
Evaluation of the quality of generated strategies when robustness tests were not used
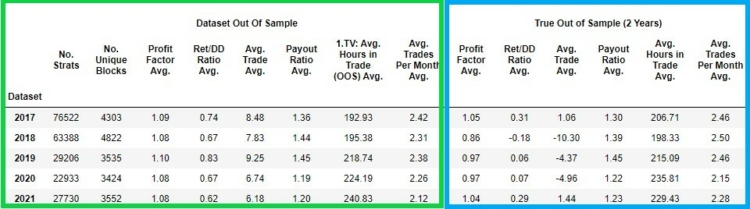
Let’s take a look at the characteristics of the individual datasets.In the following figure, we can see the qualitative characteristics of each dataset of strategies created for a given period.
In the green column we have the values of the strategy metrics gained in the out of sample period
- No. Strats – the number of strategies in a given dataset
- No Unique Blocks – number of strategies with unique input blocks
- Profit Factor Avg. – average profit factor of all 100 000 strategies in out of sample period
- Ret DD/Ratio Avg. – the average Ret DD/Ratio of all 100 000 strategies in out of sample period
- Avg. Trade Avg. – average of Avgerage Trade of all 100 000 strategies in the out of sample period
- Payout Ratio Avg. – average of Payout Ratio of all 100 000 strategies in the out of sample period
- Avg. Hours in Trade Avg. – the average number of hours of open position of 100 000 strategies in the out of sample period
- Avg Trades Per Month Avg. – average Avg. Trades Per Month of all 100 000 strategies in the out of sample period
In the blue column we have the values of the strategies in the true out of sample period
- Profit Factor Avg. – average of Profit factor of all 100 000 strategies in true out of sample period
- Avg.Trade Avg. – average of Average Trade of all 100 000 strategies in true out of sample period
- Ret/DD Ratio Avg. – the average of Ret DD/Ratio of all 100 000 strategies in true out of sample
- Payout Ratio Avg. – average of Payout Ratio of all 100 000 strategies in true out of sample period
- Avg. Hours in Trade Avg. the average number of hours of open position of 100 000 strategies in true out of sample period
- Avg. Trades Per Month Avg. – average of Avg. Trades Per Month of all 100 000 strategies in true out of sample period
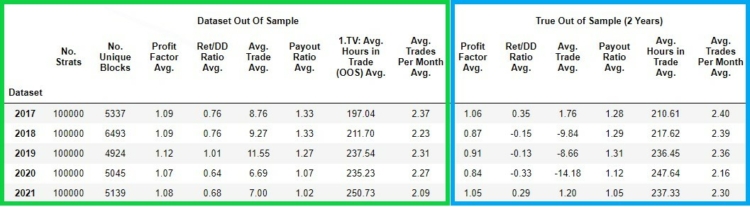
As we can see on the graph above , strategies lose their performance in true out of sample periods. Let’s notice the instability of the performance of the strategies in their true out of sample periods.
There are years when the average Profit Factor of strategies in true out of sample is above 1 and there are years ( 2018 / 2019 / 2020 ) below 1. In other words , strategies on average are losing . Similarly unstable and low values are seen in the case of Avg. Trade and Ret/DD Ratio.
Payout Ratio , Avg. Hours in Trade and Avg. Trades per month are relatively similar in out of sample and in true out of sample.
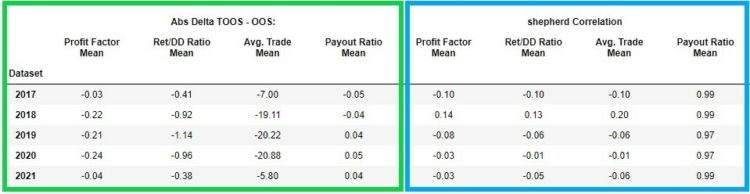
In the figure below, we see in the green box the absolute change ( delta ) between the out of sample and true out of sample of these strategy metrics:
- Profit factor ( link)
- Ret/DD Ratio ( link)
- Avg. Trade( link)
- Payout Ratio ( link)
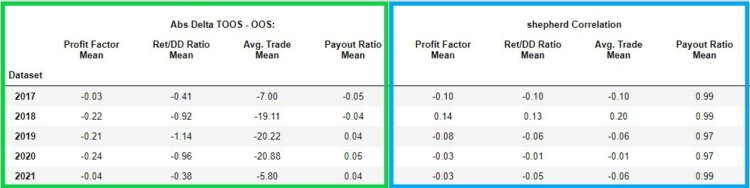
In the left part (green frame) we see the delta (difference) of the selected metrics between their out of sample and true out of sample.
In the right part (blue frame) we can see the Sheppard’s correlation coefficient in case of Profit Factor, Payout Ratio, Avg.Trade, Ret/ DD Ratio between the values of these indicators in out of sample and in true out of sample. We can see that the correlations for Profit Factor, Avg. Trade, Ret/ DD Ratio are quite low and unstable. In other words, the low values indicate low predictive value between out of sample and true out of sample.
Analyses of other data sets and other types of strategies show different performance of strategies with and without price action blocks. I will now divide the entire 5*100 000 strategy dataset into datasets
- Strategies with ONLY price action blocks without indicators
- Strategies with indicator and price action blocks
So let’s take another look at the partitioned base dataset
Dataset strategy with indicators + price action blocks
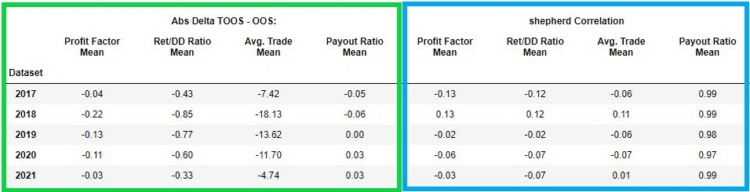
In the pictures below we can see the same statistics as above but displayed for strategies where there can be indicator + price action blocks. The structure of the displayed data is exactly the same as in the analysis of the whole dataset above.
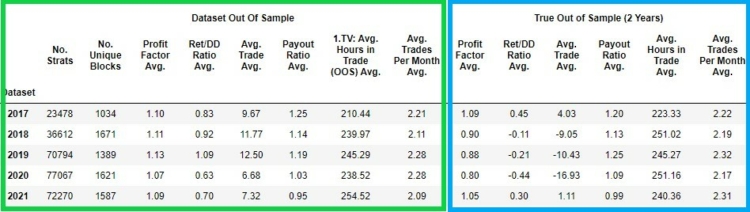
Dataset strategy only with price action blocks
In the pictures below we can see the basic charateristics of the dataset Only with price action blocks.
Short comparison of the two data sets
My hypothesis is based on a similar analysis on indexes and assumes that strategies with ONLY price-action blocks perform better in both out of sample and true out of sample. It turns out that in this analysis the assumption was not met and the better performance of strategies with indicators and price-acton blocks is maintained. Note that for out of sample, the performance is better for strategies with ONLY price action blocks, and for true out of sample, the performance is worse for strategies with only price action blocks. Although we can find some differences, they are not very significant and consistent.
Evaluating the quality of the generated strategies when robustness tests have been used
The baseline dataset consists of strategies that meet the basic out of sample requirements, and we did not perform robustness tests. The following question is whether we can achieve statistically better results between true out of sample with the selected strategies compared to the baseline true out of sample dataset (without robustness tests, only with the basic rankings mentioned above) by performing the selected robustness tests.
Description of the procedure for evaluating the effectiveness of robustness tests
The analysis process
- Perform a specific robustness test for out of sample periods in each data set
- Selecting the top 1% values of a given robustness test based on its value in the strategy metric in the out of sample
- Measure the Avg. Profit factor of a given selection on true out of sample
- Compare the Avg. Profit factor of a given selection on true out of sample with the Avg. Profit Factor on the entire true out of sample dataset
- Since we have a total of 5 data sets in different time periods, we average the results and plot the average percentile delta between the values in the baseline data set (without using the robustness test) and in the data set where we used the robustness test
Note. I did not exclude outliers from the analysis.
Strategy Metrics
We will monitor the performance of the robustness tests on these metrics:
- Profit factor
- Ret/DD ratio
- Avg. Trade
Robustness tests used
We will analyze the following robustness tests
- OOS/IS ratio
- Monte Carlo Retest Methods: Random selection of OHLC history data
- Monte Carlo Retest methods: Random selection of strategy parameters – periods
- Monte Carlo Randomize Trades Manipulation : Randomize Trades Order
- Ratio Monte Carlo Retest Methods : Retreat Carlo Methods: Randomize Strategy Parameters – Periods vs. out of sample Metrics
- Methods Ratio Monte Carlo Retest : Metrics : Randomize OHLC history data vs. out of sample metrics
- Ratio Monte Carlo Randomize Trades Manipulation : Randomize Trades Order vs. out of sample Metrics
- Average of strategy metrics in other markets
Note: Monte Carlo Randomize Strategy Parameters will only be applied to strategies with indicators and price action blocks. We do not apply this test to strategies with only price action blocks because we randomize ONLY the periods of the given indicators
Description of settings
Let’s take a brief look at how we have set the individual robustness tests.
Ratio of OOS/IS Metrics
The ratio of out of sample metrics to insample metrics.
Average of Additional Markets Matrics
We backtested the markets using the out of sample portion of the data for each dataset. It shows the average value of a given metric from backtests on all additional markets.
You can download these snippets from our sharing server here.
We have tested these markets:
- GBPJPY
- EURJPY
- GBPUSD
- USDJPY
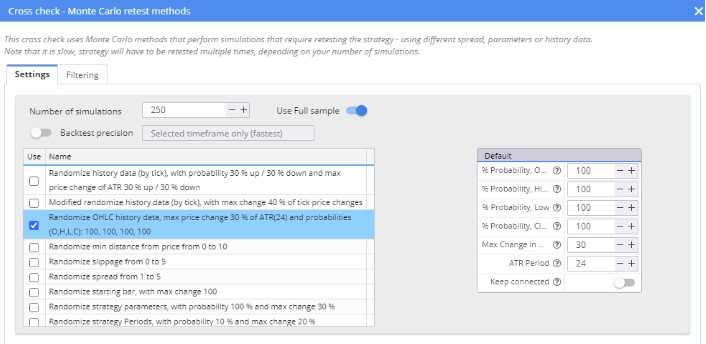
Monte Carlo Retest methods: Randomize OHLC history data
We used Randomize OHLC history data , which was added in version 136. The settings can be seen in the image below.
Monte Carlo Retest methods: Randomize Strategy Parameters – Periods
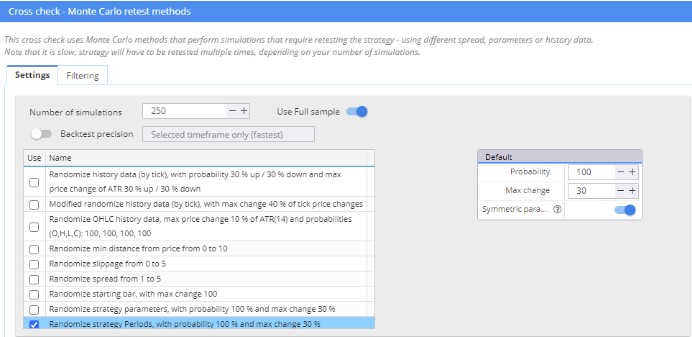
For the test of randomized strategy parameters I used a modified snippet where only the periods of the parameters were randomized.
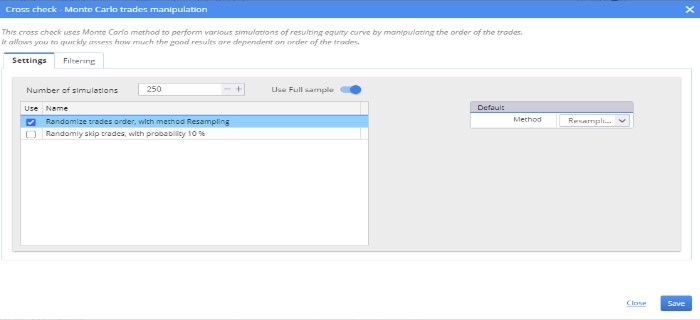
Monte Carlo Randomize Trades Manipulation : Randomize Trades Order
True OOS results for the 1% of strategies that achieved the best robustness test values ( 99th percentile )
In the figure below we see the robustness metrics sorted by Avg. Profit Factor in true out of sample vs. Avg.Profit Factor All in true out of sample in the dataset with no robustness test applied.
In the blue and white columns we see the comparison in each period in which we generated the dataset.
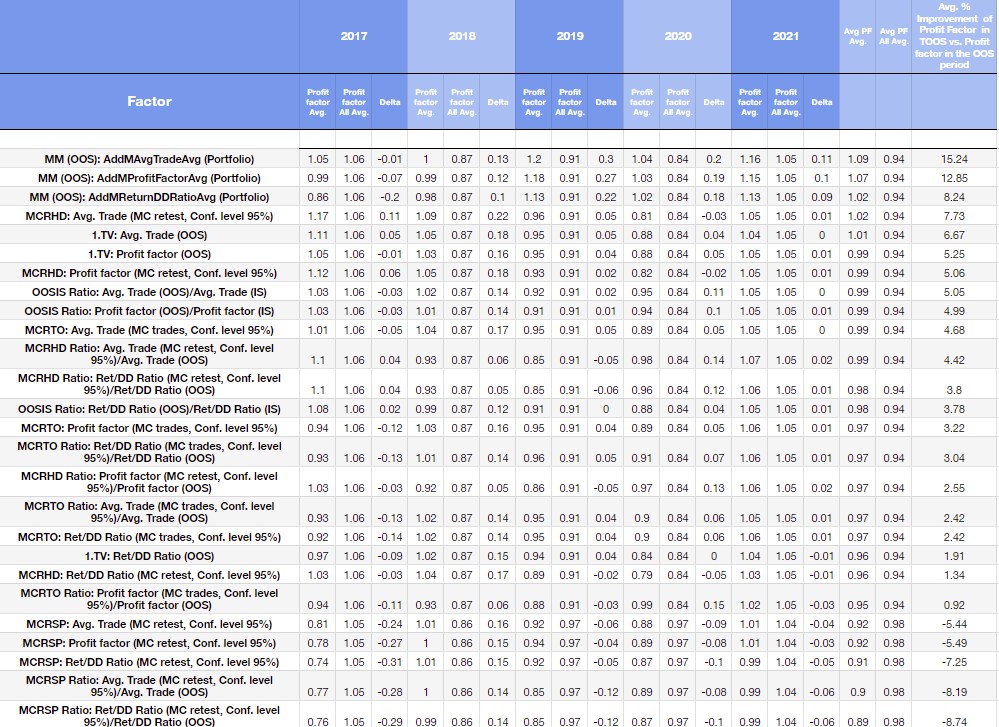
Explanatory note to the table
- OOSIS Ratio: OOS/IS ratio
- MCRHD: – Monte Carlo Retest methods: Randomize OHLC history data
- MCRSP: – Monte Carlo Retest methods: Randomize Strategy Parameters – Periods
- MCRTO: – Monte Carlo Randomize Trades Manipulation : Randomize Trades Order
- MCRHD Ratio Monte Carlo Randomize Historical data vs. out of sample metrics
- MCRHD Ratio: Ratio Monte Carlo Retest methods: Randomize OHLC history data vs. out of sample metrics
- MCRSP Ratio: Ratio of Monte Carlo Randomize Strategy Parameters vs. out of sample metrics
- MCRTO Ratio: Ratio Monte Carlo Randomize Trades Manipulation : Randomize Trades Order vs. out of sample metrics
- MM( OOS ) – Average of Strategy Metric on Additional Markets
How to evaluate the table above
The first column in the blue frame on the left shows the year 2017. Profit Factor Avg. represents the average profit factor of 1% (99th percentile) of the strategies selected after the robustness test. Profit Factor All Avg. represents the average profit factor of all strategies in a given true out of sample.
So, we selected the strategies according to the robustness test in the out of sample, but we compare the results of these strategies in the true out of sample. The delta is the absolute change in the average values.
In the blue boxes you will find all the time periods (data sets) in which we conducted the study, and in the last red column you will see the percentage change in the average of the strategies selected based on the robustness test and the entire data set.
Interpretation of the results
Among the three metrics examined, Multi Market performance of the strategies ranks first.
- MM (OOS): AddMAvg.TradeAvg (Portfolio) + 15.24%
- MM (OOS): AddMReturnDDRatioAvg (Portfolio) + 9.62%
- MM (OOS): AddMAvg.TradeAvg (Portfolio) +8.24%
The fourth efficient robustness test is the selection of 1% strategies according to MCRHD: Avg. Trade (MC retest, Conf. level 95%), which increases performance by 7.8% on average.
The other two are 1. TV: Avg. Trade (OOS), 1. TV: Profit Factor (OOS). If we were to select 1% of the stratagems according to these strategy metrics, the profit factor in OOS would increase by about 6% on average. The OOS/IS metrics also perform quite well.
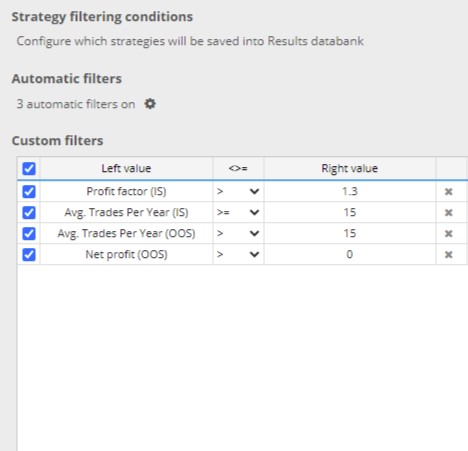
Again, I apply robustness tests ONLY to strategies filtered in the building process using the following criteria.
- Profit factor ( IS ) > 1.3
- Avg. Trades Per Year ( IS ) > = 15
- Avg. Trades Per Year ( OOS ) > = 15
- Net profit ( OOS ) > 0
As these are strategies where we did not apply advanced filtering, we did not simulate a fundamental workflow. Therefore, please take the results as an indication of the trend.
The improvement in performance of the basic metrics at OOS is also due to the fact that we used only basic rankings when creating the datasets. In other words, the criteria we used were set to generate as many profitable strategies as quickly as possible. In the next part, we will open the possibility to simulate the current rankings and apply robustness tests to these strategies.
In the picture below I attach a simplified version of the graph above.
| Type of Robustnes Test |
Avg. % improvement of Profit factor in True Out of Sample vs. Profit factor in the Out of Sample period |
| Multi Market Performance |
12.11 |
| Monte Carlo Retest methods: Randomize OHLC history data |
4.71 |
| Ratio of Out of Sample metrics vs. In Sample Metric |
4.61 |
| Out of Sample metrics (Average of Profit factor, Avg.Trade, Profit Factor ) |
4.61 |
| Ratio of Monte Carlo Retest methods: Randomize OHLC history data vs. Out of Sample metrics |
3.59 |
| Monte Carlo Randomize trades Manipulation : Randomize Trades Order |
3.44 |
| Ratio of Monte Carlo Randomize Trades Manipulation : Randomize Trades Order vs. Out of Sample metrics |
2.13 |
| Monte Carlo Retest methods: Randomize Strategy Parameters – Periods |
-6.06 |
| Ratio of Monte Carlo Randomize Strategy Parameters vs. Out of Sample metrics |
-9.09 |
In the figure above, we see the average improvement in the prfot factor for a given type of robustness. The result is the first of three metrics used to evaluate the robustness tests (Average of Profit factor, Avg.Trade, Profit Factor )
Multi Market Performance ( OOS ) would give an average of 12% improvement in the strategy’s profit factor in the true out-of-sample period. The second best robustness test is the Monte Carlo Retest method: Randomize OHLC historical data would on average result in a 4.7% improvement in the strategy’s profit factor in its true out of sample period.
Ideas, improvements and future steps
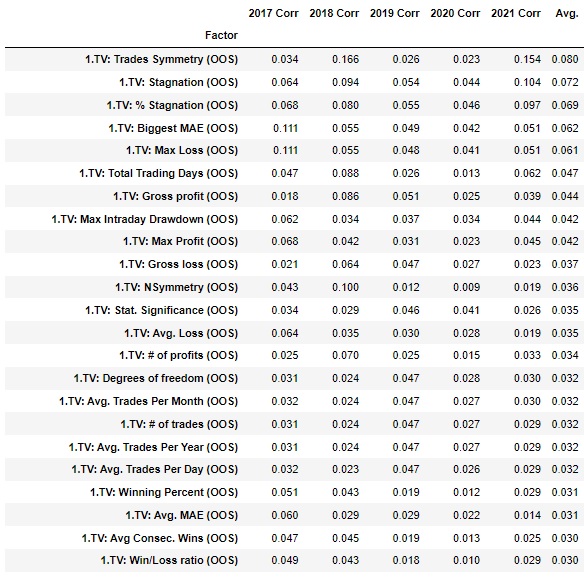
In the above analysis, we used basic metrics for strategy selection. Are there strategy metrics with higher predictive value? This problem can be clarified by different methods. Let us learn some methods from machine learning with feature extraction problems. The basic logic is that we measure the relationship between strategy metrics in out of sample and the relationship between variable dependence in true out of sample.
Maximal Information coefficient
This is a nonparametric method for evaluating both linear and nonlinear relationships between variables. In the graph below, we see the relationship between the selected variables (left column) of the out of sample and the Profit factor in the true sample in each of the data sets. These are very preliminary calculations, but note that neither the Profit factor, Avg.Trade nor the Ret/ DD ratio are in the top positions. From this information, we can conclude that there are better strategy metrics for predicting the future performance of startups that are not in the sample.
We will extend the given analysis by several steps
- We could analyze the input blocks and their average edge over periods. In this way, one could select blocks that are efficient, that maintain a stable performance.
- The selection in case of OOS /IS ratios can be done better than with the percentile method
- We can try to find better strategy metrics to select strategies with higher edges.
- We can simulate the selected workflow and apply robustness tests to the strategies obtained from it ( e.g. we choose strategies with profit factor OOS /IS profit factor > 0.9 , profit factor IS > 1.3 and apply robustness tests to them )
- We can analyze combinations of these robustness tests.
- The standard for such analyses is cross validation. In the next part we will do cross validation within a dataset but also on other datasets. ( For example we will test a dataset generated on EUR USD on USD/JPY ).
- We can use a tighter setting in the robustness tests
- We can use more markets for multimarket test. It this analysis we have used 5 markets
- We will set the individual Monte Carlo tests tighter. The Monte Carlo Randomize Strategy Parameters can be separately set more strictly.
- We can use more rigorous techniques to quantify robustness testing edge
- We could add selected values of Optimization Profiles and SPP Median indicators, Sequential Optimization to the analysis. After release 138 we will add the WFO efficiency analysis
- I used a setting of IS 30% and OOS 70% followed by True OS 2 years. There is space for experimentation here. We can use other IS and OOS settings to apply Robustness Tests on in sample periods. There are many possibilities.
Where will we go in further analyses after the final 137 version is released?
- We could analyze all external indicators and character rules based on them. Over the last years we have added several high quality indicators and snippets whose predictive value is significantly higher than the built-in indicators in SQX
- It is possible to test different True Of Sample lengths, different input and output settings and different time frames. I chose 2 years of True Of Sample to have a higher statistically significant sample in the analysis.
Conclusion and recommendation
In the introductory part, we suggested that the most effective test of the 4-Hour Time Frame on EURUSD is to test a multi-market strategy – multi-market robustness. We have found that some strategy metrics can have higher predictive value than others. We have found that randomizing historical data can also lead to interesting improvements.
I will return to this data set in an article in October, where we will try to apply some of the improvements mentioned at the end of the article. Then we will do a similar data set in November and Decemeber with the improvements and focus on the strategies and hourly time frame of the indices.
I welcome all constructive suggestions and criticisms.


 Tomas Vanek

Interesting article. Thank you very much. Question, any thoughts of using R-Square as a fitness function?
Thank you,
Red
Hey, Redlock. In this research I did not find a significant relationship between R Squared and True Out Of sample performance.
“Excellent article. As always! Did you use any criteria in the selection of currencies? Any specific correlation?”
Thank you!
Hey Diego. I picked based on liquidity but next time I will pick markets based on correlation. It was not an ideal choice.
Awesome article, thanks much.
Question, can we also include the effect of Edge Ratio to robustness test on Forex market?
Hey, Stu. Do you have a concrete idea how to implement the Edge Ratio robustness test?
How about using the same approach as described in this blog:
https://strategyquant.com/blog/edge-ratio-in-strategyquant-x
This kind of work is very good, in the end we want to know what tests gives true value in the live trading because if you run all of them it’s time consuming and hardly any strategy comes out.
Mikael
Thanks Mikael , Yes I agree
Hi,What range of currency pair correlation should be used when choosing a Multi Market? Should currency pairs with a correlation close to zero be used for robustness testing?
I personally don’t like Additional Market Retest because selecting market is very subjective. You can argue that your strategies are robust, so they can survive in their own generated market and break even on 4 others. It simply means that the passed strategy is curve fitted to its IST data and barely survive on 4 others. Nothing more and nothing less. A while ago, I performed a research on on Additional Market Retest training strategies on GBPJPY H1 then retesting them on M30 and H4 with filter requirement of profit factor >1.1 similar to SQX’s default custom projects. These strategies… Read more »
Thanks a lot for your considerations. Really food for thought.
Amazing article! Please keep these coming!