Documentation
Applications
Last updated on 1. 3. 2019 by Kornel Mazur
Monte Carlo trades manipulation
This cross check run simulations where in each simulation it manipulates the existing trades – shuffles them, misses some and so on.
It is very quick, because it doesn’t require running backtests, it works on already existing trades from main backtest.
The idea behind this is to verify how much the strategy equity curve depends on particular order of the trades, and what would happen if some trades are missed.
You can do these trade manipulations in every simulation:
Randomize Trades Order – this is the simplest test, it randomly shuffles order of the trades. This doesn’t change the resulting Net Profit, but it is very useful in examining different variations of Drawdown that can be a result of different order of trades.
Randomly Skip Trades – it will randomly skip trades with given probability. In real trading you can often miss a trade because of platform or Internet failure, or simply because you paused trading for some time. This test will give you an idea how the equity curve might look like if some trades are randomly skipped.
Interpreting the results
Robustness tests output the results as a set of equity charts for each testing run AND a table showing the results of Monte Carlo simulation.
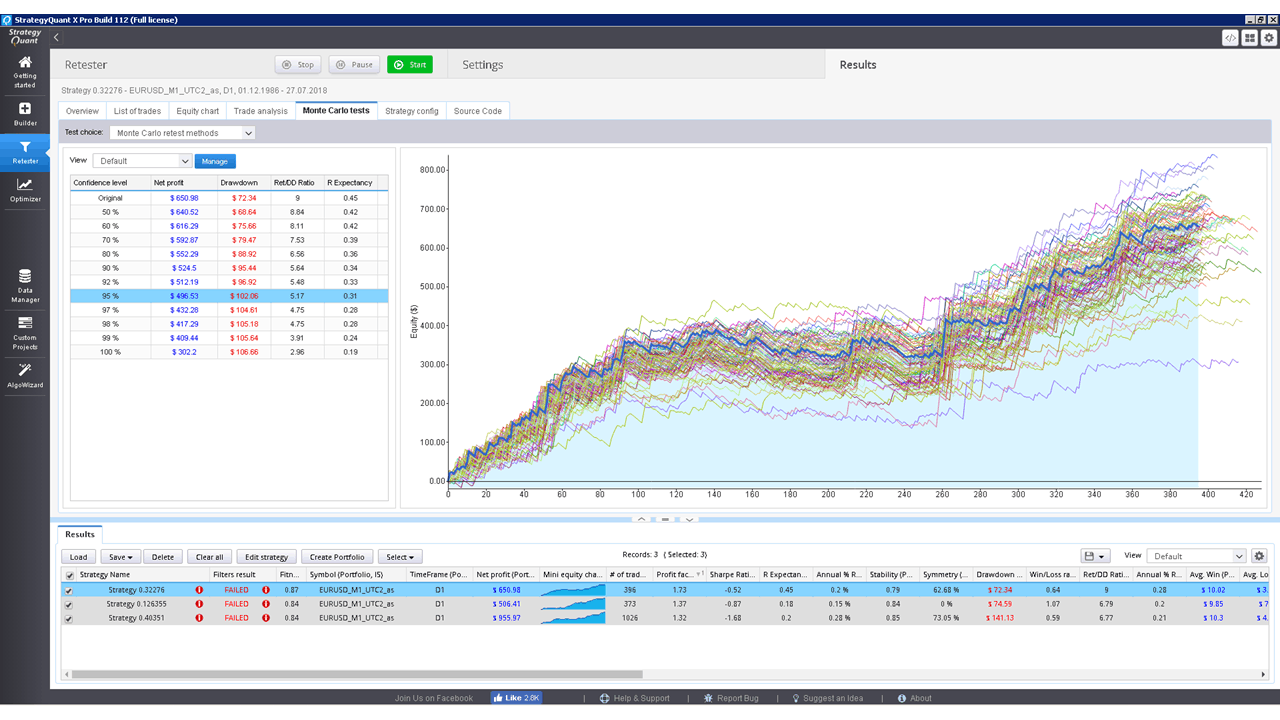
In this example we’ve run 100 simuations, with randomly skipped trades.
We can see what would be the equity for each of these simulations and the table on the left provides us the valuable information on the strategy properties during these simulations.
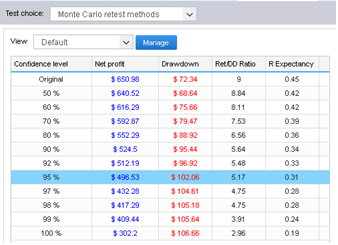
What do these values mean?
The first row displays values of Net Profit, Maximum % Drawdown etc. of original strategy for comparison.
The rest of the rows display values at different confidence levels.
These numbers are a result of Monte Carlo analysis applied on our 10 random simulations.
For example, values at 80% confidence level mean that there is 20% chance that Net Profit, Drawdown etc. will be worse than the confidence level values.
Values at 90% confidence level mean that there is 10% chance that Net Profit, Drawdown etc. will be worse than the confidence level values.
Values at 95% confidence level mean that there is only a 5% chance that Net Profit, Drawdown, etc. will be worse than these values.
So Monte Carlo simulation of our strategy shows us that by skipping 10% of random our Net Profit can decrease from $ 6990 to $ 3943, and Maximum Drawdown can increase from 6.97% to 11.36%.
This means that there is only 5% chance that Net Profit will be lower than $ 3943. By looking at the higher confidence levels we can see that none of our tests had worse results than $ 3943, so the strategy seems to be relatively robust to the changes we exposed it to.
Because Monte Carlo simulations are generated randomly, equity charts and values in the table will slightly differ every time you retest the strategy. Also, the more simulations you’ll run, the bigger statistical significance of this test.
Was this article helpful? The article was useful The article was not useful
where can I read in detail the difference between exact and resampling tests as well as how these tests affect the whole simulation?
Hello, with re-sampling the program randomly picks total number of trades from the pool of all trades in history. The difference is that in this method the list of trades might not be the same. It can pick one trade multiple times and some other trade might not be picked at all.
With the exact method all trades are considered
Hi Tomas, could you please explain this? I don’t see what the figures in this text copied from above refer to. I am revising Monte Carlo testing. “So Monte Carlo simulation of our strategy shows us that by skipping 10% of random our Net Profit can decrease from $ 6990 to $ 3943, and Maximum Drawdown can increase from 6.97% to 11.36%. This means that there is only 5% chance that Net Profit will be lower than $ 3943. By looking at the higher confidence levels we can see that none of our tests had worse results than $ 3943,… Read more »
The figures are wrong compared to the picture. This (and many other articles) contains various errors and omit important details like:
In Monte Carlo simulations, the “exact” method generates random samples directly from the true target distribution using its known mathematical form, so each draw is independent and already correctly distributed. “Resampling”, by contrast, first creates a weighted set of samples (often from an easier proposal distribution) and then draws new samples from this set according to their weights; this approximates the target distribution but introduces dependence between samples and some loss of information. In short: exact = direct, independent draws from the true distribution; resampling = indirect, weight-based approximation from an existing sample set. The full sample option allows you… Read more »