In today’s blog post, I will try to summarize some important ideas from the book Evidence Based Technical Analysis by David Aronson. The book was published in 2006 and became popular fairly quickly.
Evidence-Based Technical Analysis thematically addresses the issue of statistical analysis in the context of strategy development and the issue of data mining that users are concerned about. StrategyQuant x is de facto a sophisticated data mining tool that needs to be deployed and set up in a way that reduces the risk that strategy performance is actually a product of chance.
The first part deals with philosophical questions of scientific knowledge. It discusses technical analysis and analysis as tactics from the perspective of philosophy, methodology, and logic, and overall focuses more on theoretical and philosophical issues and their implications for practice.
The second part addresses the use and arguments for using rigorous statistical methods, particularly interference statistics, in analyzing the performance of an algorithmic strategy. The third part addresses what might concern us most as SQX users – data mining biases associated with multiple comparison methods. The fourth part addresses the use of various methods in data mining, including the use of algorithms in strategy search, the use of confirmation methods in data mining, etc.
This blog post aims to pull out the basic concepts that David Aronson works with and apply them to the topic of StrategyQuant X development. I have focused on the parts that most concern SQX users, taking into account the most common mistakes that newbies make when setting up the program.
I first cite David Aronson’s short BIO:
[1]“David Aronson, author of “Evidence-Based Technical Analysis” (John Wiley & Son’s 2006) is an adjunct professor of finance at the Zicklin School of Business where he has taught a graduate-level course in technical analysis and data mining since 2002.
In 1977, Aronson left Merrill Lynch to begin an independent study of the nascent field of managed futures strategies and in 1980 formed AdvoCom Corporation, an early adopter of modern portfolio theory methods and computerized performance databases for the creation of multi-advisor futures portfolios and funds. A representative portfolio that began in 1984 has earned a compounded annual return of 23.7%. In 1990 AdvoCom advised Tudor Investment Corporation on their public multi-advisor fund.
In the late seventies, while conducting research in computerized strategies for managed futures Aronson realized the potential of applying artificial intelligence to the discovery of predictive patterns in financial market data. This practice, which is now gaining acceptance on Wall Street, is referred to as data mining. In 1982 Aronson founded Raden Research Group, an early adopter of data mining and non-linear predictive modeling to the development of systematic trading methods. Aronson’s innovation was applying data mining to enhance traditional computerized trading strategies. This approach was described for the first time in Aronson’s article, “Pattern Recognition Signal Filters”, Market Technican’s Journal – Spring 1991. Raden Research Group Inc. conducted predictive modeling and filter development research on behalf of various trading firms including Tudor Investment Corporation, Manufacturers Hanover Bank, Transworld Oil, Quantlabs, and several large individual traders.”
The book begins with a definition of the basic concepts of technical analysis and attempts to define the whole subject from the point of view of logic. It discusses philosophical, methodological, statistical, and psychological issues in the analysis of financial markets and emphasizes the importance of scientific thinking, judgment, and reasoning.
Aronson works with two definitions of technical analysis
- Subjective technical analysis (TA)
- Objective technical analysis (TA)
Subjective TA, according to Aronson, does not use repeatable scientific methods and procedures. It is based on analysts’ personal interpretations and is difficult to prove from a historical perspective through backtesting. In contrast, the objective TA is based on the use of backtesting methods and the use of objective statistical analysis of backtesting results, according to Aronson.
The use of scientific methods in technical/quantitative analysis is the basic theme of the entire book.
[2] “Objective TA can also spawn erroneous beliefs but they come about differently. They are traceable to faulty inferences from objective evidence. The mere fact that an objective method has been profitable in a back test is not sufficient grounds for concluding that it has merit. Past performance can fool us. Historical success is a necessary but not sufficient condition for concluding that a method has predictive power and, therefore, is likely to be profitable in the future. Favorable past performance can occur by luck or because of an upward bias produced by one form of backtesting called data mining. Determining when back-test profits are attributable to a good method rather than good luck is a question that can only be answered by rigorous statistical inference.”
Aronson criticizes the subjective TA methods but also emphasizes that mistakes can be made even when using objective TA.
In this part, I was very interested in the part about the various forms of errors that are common or occur in solving analytical problems. Among the methods of analysis are the so-called biases that occur when understanding things
- Overconfidence bias
- Optimism Bias
- Confirmation Bias
- Selection Bias
- Illusory correlations
- Optimism Bias

Source: Aronson, D. R. (2021). In Evidence-based technical analysis: Applying the scientific method and statistical inference to trading signals (pp. 42–42). essay, John Wiley & Sons.
It is the subjective TA analysis that can often be based on the biases described by Aronson, but he points out that even with objective – statistical TA biases often occur unconsciously. Therefore, he proposes the use of the so-called objective TA in the form of the application of scientific methods in the analysis.
Aronson summarizes the steps of hypothesis formulation in interference analysis – deductive method
- Observation
- Hypothesis
- Prediction
- Verification
- Conclusion
In the following chapters, Aronson explains the importance of rigorous statistical analysis in evaluating strategies.
[3]“Inferential statistics helps to develop a good understanding of the population data by analyzing the samples obtained from it. It helps in making generalizations about the population by using various analytical tests and tools. To pick out random samples that will represent the population accurately many sampling techniques are used. Some of the important methods are simple random sampling, stratified sampling, cluster sampling, and systematic sampling techniques.”
Aronson defines it in the context of the use of Technical Analysis:
[4]“Identifying which TA methods have genuine predictive power is highly uncertain. Even the most potent rules display highly variable performance from one data set to the next. Therefore, statistical analysis is the only practical way to distinguish methods that are useful from those that are not. Whether or not its practitioners acknowledge it, the essence of TEA is statistical inference. It attempts to discover generalizations from historical data in the form of patterns, rules, and so forth and then extrapolate them to the future. Extrapolation is inherently uncertain. Uncertainty is Uncomfortable.”
In the context of strategy development in StrategyQuant, X can be viewed as a sample from the population.
- List of trades and their trade metrics
- List of strategies in databank and their strategy metrics
I do not want to marginalize the topics of interference statistics, hypothesis testing, and descriptive statistics, but their scope and implications go far beyond the scope of this article, so
I recommend that you work through these resources:
Data Mining
[5]Data mining is the extraction of knowledge, in the form of patterns, rules, models, functions, and such, from large databases.
For us as users of StrategyQuant X, we likely use some form of data mining in our search for profitable strategies
With StrategyQuant X, we typically use data mining when we are looking for
- Strategy search ( Builder )
- Strategy Optimization ( Optimization )
Aronson mentions the differences between classical strategy development and data mining:
- We consider the classical method as the one where a developer creates a strategy from scratch without using data mining methods. In the context of StrategyQuant X, we could think of manual strategy creation in Algowizard, where we can create strategies according to our logic.
- When using data mining, we test a large number of rules to find the strategy with the highest observed performance and the highest probability of future performance..
Aronson argues for the use of data mining as follows:
-
[6]First, it works. Experiments presented later in this chapter will show that under fairly general conditions, the greater the number of rules back tested the greater the likelihood of finding a good rule.
-
Second, technological trends favor data mining. The cost-effectiveness of personal computers, the availability of powerful back-testing and data-mining software, and the availability of historical databases now make data mining practical for individuals. As recently as a decade ago, the costs limited data mining to institutional investors.
-
Third, at its current stage of evolution, TA lacks the theoretical foundation that would permit a more traditional scientific approach to knowledge acquisition
Data Mining Bias
Aronson argues that biases in data mining could be a possible major reason for the failure of strategies in out-of-sample or real trading.
[7]”Data-mining bias: the expected difference between the observed performance of the best rule and its expected performance. Expected difference refers to a long-run average difference that would be obtained by numerous experiments that measure the difference between the observed return of the best rule and the expected return of the best rule.”
It considers the two main components of observed performance (strategy performance) as follows.
- Predictability of the strategy
- Randomness – Luck
[8]“Now we come to an important principle. The larger the contribution of randomness (luck) relative to merit in observed performance ( Backtest results ), the larger will be the magnitude of the data-mining bias. The reason is this: The greater the role of luck relative to merit, the greater the chance that one of the many candidate rules ( strategies ) will experience an extraordinarily lucky performance. This is the candidate that will be selected by the data miner. However, in situations where observed performance is strictly or primarily due to a candidate’s true merit, the data-mining bias will be nonexistent or very small. In these cases, a candidate’s past performance will be a reliable predictor of future performance and the data miner will rarely fill the hopper with fool’s gold. Because financial markets are extremely difficult to predict, most of a rule’s observed performance will be due to randomness rather than its predictive power. “
In the context of Strategy Quant X, we can say that the element of chance is associated with the more benevolent attitude of StrategyQuant X. If we choose too many combinations when searching for strategies, StrategyQuant X may find one that has a positive backtest but does not work in the reality of the strategy. Below at the end of the blog post, the factors that influence this randomness are summarized with tips in the StrategyQuant X setup.
Much attention is also paid to the Multi Comparison Procedure (MCP ). Wikipedia definite multiple comparison procedures as :
[9]“Multiple comparisons arise when a statistical analysis involves multiple simultaneous statistical tests, each of which has the potential to produce a “discovery.” A stated confidence level generally applies only to each test considered individually, but often it is desirable to have a confidence level for the whole family of simultaneous tests.”
In the context of StrategyQuant X, we can apply the problem of multiple comparisons wherever we are looking for a large number of indicators/conditions/settings of a particular strategy in a large spectrum. Using the methods of multiple comparisons, we can easily determine that the solution found, in our case the strategy and its out-of-sample performance is the result of chance and a large number of tested combinations. The more rules and the more variability used in the SQX setup, the higher the probability that the performance of the strategy in OS is a product of chance and therefore the higher the probability that the strategy will fail in real trading.
Aronson proves the conclusions presented in the following section by experimentally running the data-driven trading rules for the S&P 500 Index over the period from 1328 to 2003. The exact procedure can be found on page 292. A similar experiment can be easily repeated in StrategyQuant X for any market.
5 Factors Influencing the Degree of Data Mining Bias
-
Number of rules back-tested:
[10]“This refers to the total number of rules backtested during the data-mining process en route to discovering the highest-performing rule. The larger the number of rules tested, the larger the data-mining bias.”
Implications Number of rules back-tested when developing strategies in StrategyQuant X
The number of Rules used in the strategy search can be influenced in StrategyQuant X in the following settings in Builder/ What to build:
- Parameter range ( periods)
- Lookback period
- Settings of Stop Losses and Profit targets
- Set the maximum number of rules in case of entry and exit
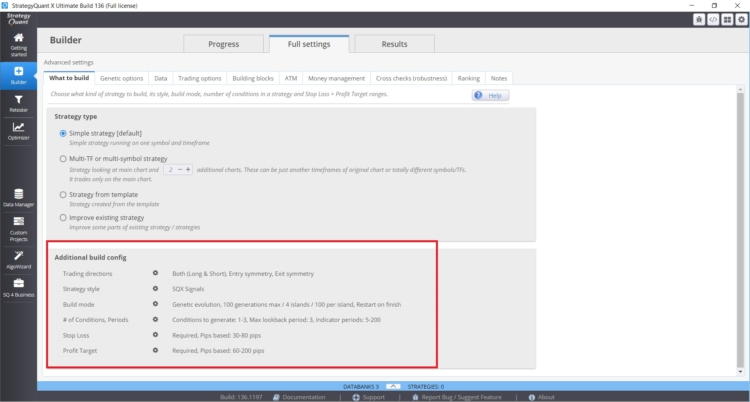
In this case, the larger the values and ranges you specify, the greater the risk of data mining bias. A good practice is to use a maximum of two input rules, for the loopback period I would stick with a maximum value of 3. I often see from clients strategies with 6 conditions and lookback periods of 25. There is a real risk of data mining bias with these combinations.
If you want to set specific lookback periods for specific blocks where it makes sense (Daily Close, etc.), you can set them directly for a specific rule, as you can see in the figure below:
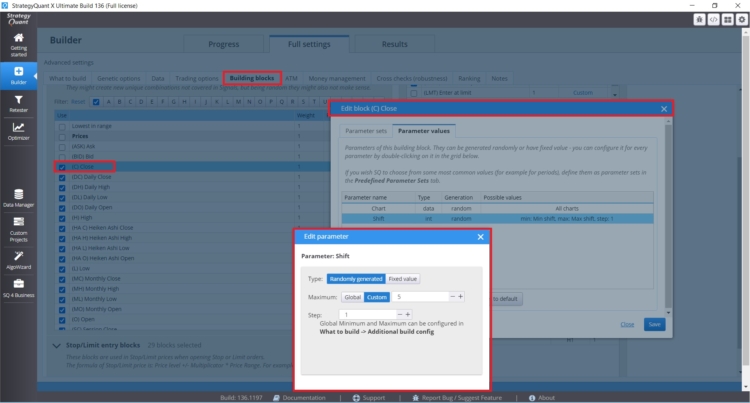
You can also directly control the building block types, quantity, and settings in the Builder – Tab with Entry Indies/Rules.
Number of Indicators, Conditions, and Comparison blocks:
- Number of possible entry blocks
- Number of possible exit blocks
- In the case of Stop/Limit orders the number of indicators stop limit is important
- Types of outputs and inputs and their settings.
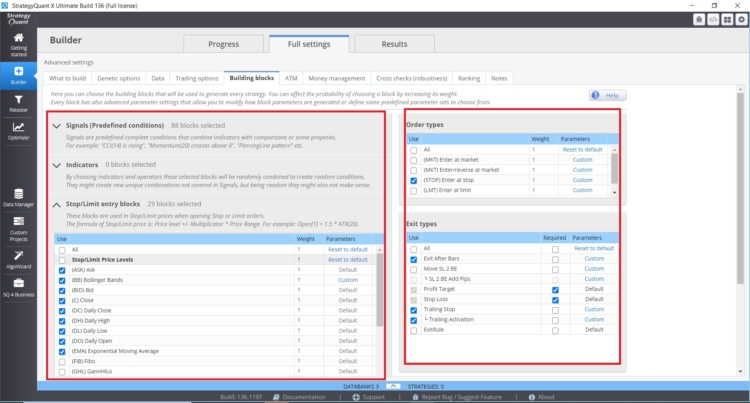
The more options we put into the StrategyQuant X genetic engine the greater the data mining bias can be.
-
The number of observations used to compute the performance statistic:
[11]The larger the number of observations, the smaller the data-mining bias.
Implications of Number of observations in strategy development in StrategyQuant X:
In general, the larger the data sample (number of trades in out of sample), the higher the statistical power of the results.
This can be achieved by:
- Bigger out-of-sample data = larger sample size
- More markets tested = larger sample size
- More time frames tested = larger sample size
Also, from an interference statistics perspective, the identified strategy indicators have higher predictive value when the sample is large enough Similarly, the identified strategy statistics have more weight when the identified sample size is larger. It should be emphasized that the in-sample results need not be considered if the out-of-sample performance of the strategy is of greater value. However, this is also affected by data mining biases associated with the multiple comparison procedure. In practice, this may mean that the actual performance is very likely to be worse than the out-of-sample backtest performance.
This point is considered by Aronson to be the most important of all factors. He argues that the larger the sample of data obtained, the smaller the negative impact of the other factors. When optimizing an existing strategy, pay attention to the parameter ranges and the number of steps. In general, the more options, the greater the chance of chance.
How to set backtest range and out of sample period in StrategyQuant X
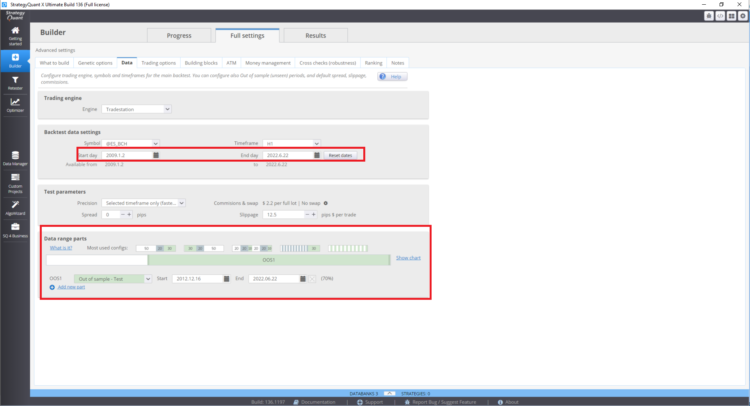
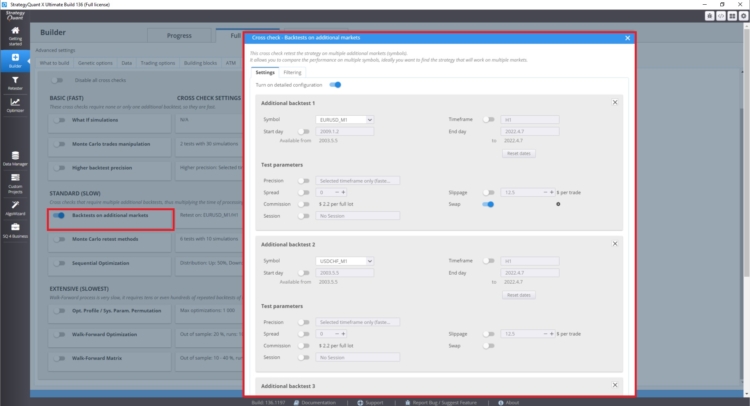
How to set up multi-market testing
In the cross-check section under Backtest on additional markets you can set backtests on additional markets.
Where to set the fitness function and ranking true in StrategyQuant X
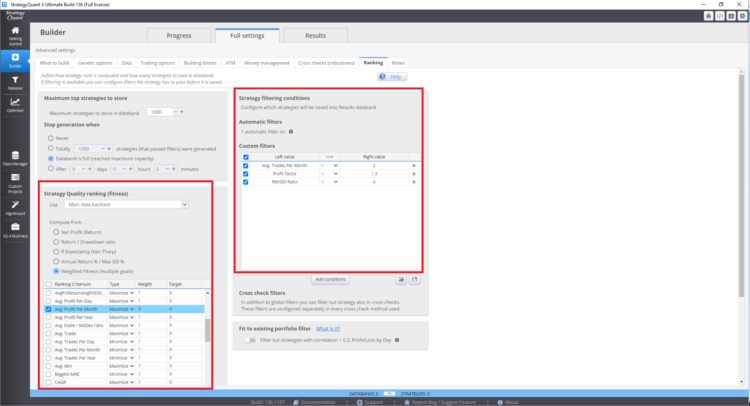
These settings can affect the resulting strategies in the databank.
-
Correlation among rule returns
[12]This refers to the degree to which the performance histories of the rules tested are correlated with each other. The less correlated they are, the larger the data-mining bias.
The stronger the correlation between the rules tested, the smaller will be the magnitude of the bias. Conversely, the lower the correlation (i.e., the greater the degree of statistical independence) between rules returns, the larger will be the data-mining bias. This makes sense because increased correlation among the rules has the consequence of shrinking the effective number of rules being back-tested.
This point is difficult to grasp. It is based on knowledge of the first point. The number of correlated strategies in the StrategyQuantX can be affected by the type of building blocks used in strategy construction, but also by the setting of the genetic search for strategies. For example, if you choose only moving averages as building blocks, it is more likely that the strategies will be more correlated with each other.
If the number of building blocks is very low, you will not realize the potential of data mining; on the contrary, if the number of building blocks is very high, you risk a large data mining bias. These factors can also be eliminated by a high number of trades or by multi-market testing.
You can manage these setting in Builder/ Genetic options.
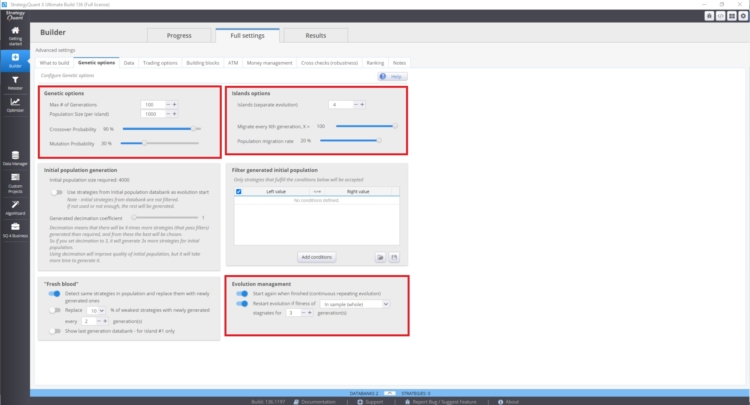
The speed of convergence of the fitness curve and the variability of the strategies depends on:
- Higher value of crossover probability
- Lower value of the mutation probability
Island evolution can also have a major impact. This provides for the migration of strategies between islands. Evolutionary management can also play an important role. Especially if we restart genetic evolution with too many generations. You may end up with more correlated strategies in the databank.
These settings may contradict each other and their use depends on a case-by-case basis. This problem is not easy to understand, because the state of your database depends on many factors.
-
Presence of positive outlier returns
[13]This refers to the presence of very large returns in a rule’s performance history, for example, a very large positive return on a particular day. When these are present, the data-mining bias tends to be larger, although this effect is reduced when the number of positive outliers is small relative to the total number of observations that are used to compute the performance statistic. In other words, more observations dilute the biasing effect of positive outliers.
If you have a strategy whose performance is affected by a small number of trades, you should pay attention. In StrategyQuant X there are What-if crosschecks that will help you deal with such situations
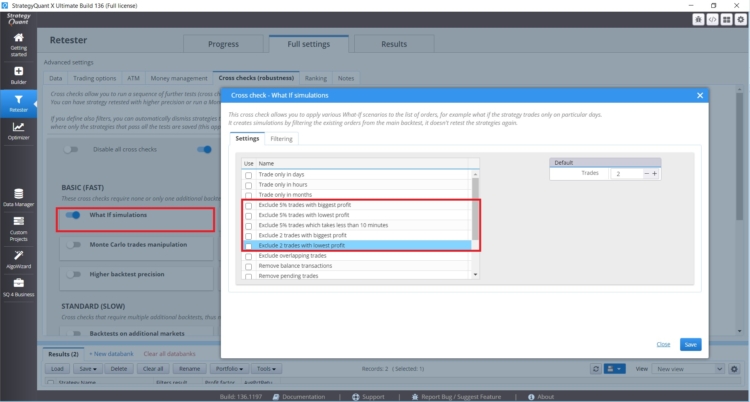
These What If Cross Checks allow you to test the performance of the strategy without the most profitable or the most profitable trades. If the results of the strategy are unreasonably different, you need to be careful.
-
Variation in expected returns among the rules
[14]This refers to the variation in true merit (expected return) among the rules back-tested. The lower the variation, the greater the data-mining bias. In other words, when the set of rules tested has similar degrees of predictive power, the data-mining bias will be larger.
This phenomenon can be measured by analyzing the variability of the results in the database. According to Aronson, the greater the variability of strategy performance metrics in the databank, the greater the risk of bias from data mining. To analyze the results of the entire databank, you can use a custom analysis or export the database and analyze it externally in Excel or Python.
Also worth mentioning are the proposed tools for dealing with data mining bias
- Out-of-sample testing
- Use of randomization techniques
- Monte Carlo permutation testing
- White reality check
- Penalizing strategy metric
From here we can directly influence the sample size and we also have Monte Carlo tests available directly in StrategyQuant X.
Conclusion
From my point of view, the easiest thing to do is to focus on the following.
- The largest number of out-of-sample trades possible.
- Testing multiple markets/time frames
- Not using all possible methods at the same time
- Setting building blocks according to the type of strategies I want to find
Personally, I have read the book 3 times at different stages of my development and it has always moved me forward. It has confirmed in taking a critical stance toward different paradigms in the field of trading and quantitative methods is a good if sometimes difficult way. Very good insights can also be found on our blog in articles about interviews with traders or on the website https://bettersystemtrader.com/

Footnotes
[1] Authors Website, https://www.evidencebasedta.com/
[2] Aronson, D. R. (2021). In Evidence-based technical analysis: Applying the scientific method and statistical inference to trading signals (pp. 6–6). essay, John Wiley & Sons.
[3] https://www.cuemath.com/data/inferential-statistics/
[4]Aronson, D. R. (2021). In Evidence-based technical analysis: Applying the scientific method and statistical inference to trading signals (pp. 165–165). essay, John Wiley & Sons.
[5] Aronson, D. R. (2021). In Evidence-based technical analysis: Applying the scientific method and statistical inference to trading signals (pp. 264–264). essay, John Wiley & Sons.
[6] Aronson, D. R. (2021). In Evidence-based technical analysis: Applying the scientific method and statistical inference to trading signals (pp. 268–268). essay, John Wiley & Sons.
[7] Aronson, D. R. (2021). In Evidence-based technical analysis: Applying the scientific method and statistical inference to trading signals (pp. 256–256). essay, John Wiley & Sons.
[8] Aronson, D. R. (2021). In Evidence-based technical analysis: Applying the scientific method and statistical inference to trading signals (pp. 280–280). essay, John Wiley & Sons.
[9] Source: https://en.wikipedia.org/wiki/Multiple_comparisons_problem
[10] Aronson, D. R. (2021). In Evidence-based technical analysis: Applying the scientific method and statistical inference to trading signals (pp. 289–289). essay, John Wiley & Sons.
[11] Aronson, D. R. (2021). In Evidence-based technical analysis: Applying the scientific method and statistical inference to trading signals (pp. 289–289). essay, John Wiley & Sons.
[12] Aronson, D. R. (2021). In Evidence-based technical analysis: Applying the scientific method and statistical inference to trading signals (pp. 289–289). essay, John Wiley & Sons.
[13] Aronson, D. R. (2021). In Evidence-based technical analysis: Applying the scientific method and statistical inference to trading signals (pp. 289–289). essay, John Wiley & Sons.
[14] Aronson, D. R. (2021). In Evidence-based technical analysis: Applying the scientific method and statistical inference to trading signals (pp. 289–289). essay, John Wiley & Sons.

 Ellie Souckova

hi thank you for all your hard and informative could you elaborate what exactly your penalizing strategy metric is
Excellent review of Aronson’s work with respect to StratQuant. What was not explicitly explained was the concept of “degrees of freedom” as explained in Robert Pardo’s book, “Design, Testing, and Opimization of Trading Systems,” (1992) and his second edition, (2008). From the 1st edition, “Placing to many restrictions on the price data is the primary cause of overfitting” pg. 138.
Good work.