Adaptive trading systems are strategies designed to “learn” from historical market and asset data, enabling them to adjust their rules to align with new market dynamics. A self-adaptive or auto-adaptive trading system can modify its buy and sell rules based on the performance of these rules in the past.
In algorithmic trading, traders rely on various strategies and technical indicators to make data-driven decisions about when to enter or exit trades. A key component in these strategies is the use of comparison blocks, which are essential tools for identifying market conditions and generating trade signals. One of the new advanced comparison blocks is the “Crosses Above Adaptive/Crosses Below Adaptive” block.
This article delves into the concept of comparison blocks, explaining their function and significance in automated trading. It also provides a detailed analysis of the Crosses Above Adaptive block, exploring the logic behind its adaptive nature, how it responds to changing market conditions, and how incorporating it can enhance your overall trading strategy.
Understanding Comparison Blocks in Trading Strategies
In StrategyQuant X, comparison blocks are essential tools used to compare different indicators, prices, or values on a chart. They help define conditions that can trigger buy or sell signals in an automated trading strategy. For example, a comparison block can check if a short-term moving average crosses above a long-term moving average, signaling a potential buy opportunity.
Comparison blocks act like decision-making checkpoints, answering questions such as “Is one value higher than another?” or “Has an indicator crossed a key threshold?” By combining multiple comparison blocks, traders can create sophisticated rules to refine their strategies and improve decision-making based on market conditions.
There are several types of comparison blocks designed to help traders build automated trading strategies by comparing different indicators, prices, or custom values. These blocks allow for flexible and precise control over when certain conditions are met. Here are the main types of comparison blocks available in StrategyQuant X:
- Crosses Above / Crosses Below
- Greater Than / Less Than
- Equal To / Not Equal To
- Greater Count / Lower Count
- Greater Percentile / Lower Percentile
- Greater Than or Equal To / Less Than or Equal To
- Is True / Is False
While basic comparison blocks are widely used in trading strategies, they have a significant limitation: they don’t account for the reliability of the signal. For instance, just because an indicator crosses above another doesn’t guarantee a profitable trade. This brings us to adaptive comparison blocks, which offer a more sophisticated approach by considering historical performance and market conditions before confirming a signal.
Introduction to Adaptive Crossover Signals: “Crosses Above Adaptive/Crosses Below Adaptive”
The Crosses Above Adaptive block is an advanced type of comparison block. Unlike a simple crossover, which only looks at present market conditions, the adaptive version digs deeper.It doesn’t just check whether one indicator has crossed above another; it also evaluates the past performance of similar crossovers and determines whether the signal is statistically reliable.
The goal of this block is to provide more intelligent signals—signals that have a higher probability of success based on historical data, rather than relying solely on real-time crossovers, which can often lead to false signals.
How Adaptive Trading Signals Work
Let’s start with the basics of a crossover signal. A crossover occurs when one indicator (often a short-term moving average) crosses above or below another indicator. A “crosses above” event can signal that momentum is shifting upwards, suggesting a buy opportunity.
In a simple crossover strategy, traders would react immediately when such a crossover occurs. However, this often leads to overtrading or reacting to signals that aren’t profitable because the markets are dynamic and full of noise.
The Limitations of Simple Crossover Signals
While crossovers are straightforward and easy to understand, they are not always reliable. In volatile markets, prices can quickly move in one direction, trigger a crossover, and then reverse shortly after. This causes traders to enter trades based on signals that may not lead to sustained market movements.
In other words, simple crossover strategies are rigid. They do not take into account the historical success rate of similar crossovers. This is where adaptive comparison blocks like Crosses Above Adaptive come into play.
How the Adaptive Mechanism Works
The Crosses Above Adaptive / Crosses Below Adaptive block enhances traditional crossover strategies by integrating an additional layer of evaluation. Here’s how it operates:
- Basic Crossover Event
The first step is detecting the occurrence of a basic crossover event. This happens when Indicator A crosses above Indicator B, such as a 20-period moving average crossing above a 50-period moving average, or RSI(14) crossing above 50.
- Historical Performance Evaluation
Once the crossover event is identified, the system evaluates its historical performance. It checks how similar crossover events have performed in the past, based on a specified number of historical bars (X-bars) and trades (X-trades). This acts as a backtest within a backtest, analyzing past performance to gauge the potential reliability of the current signal.
- User-Defined Metrics and Thresholds
The performance of the crossover is then compared against user-defined thresholds. The user can choose different evaluation metrics, such as:
- Profit Factor
- Win Percentage
- Average Performance
- Internal Profit Factor
- Final Decision: Adaptation to Market Conditions
After evaluating the historical performance and comparing it to the user-defined thresholds, the system checks whether the current market conditions resemble those in which the signal historically performed well. If the conditions and metrics align (e.g., profit factor > 1.5), the trade is confirmed. Otherwise, the system refrains from entering a trade, reducing the risk of false signals.
Important Parameters of the Comparison Block
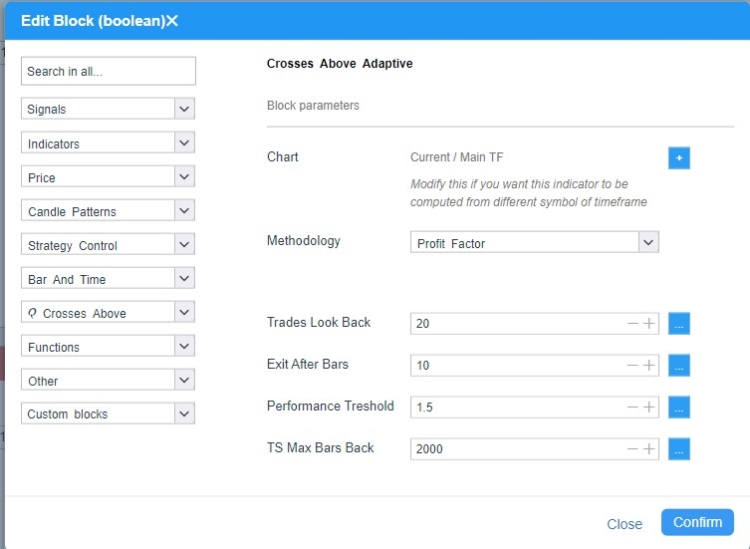
In the image above, you can see the settings of the Comparison block Crosses Above Adaptive.
Once a crossover is detected, the signal is only confirmed if key conditions are met. The following parameters are essential in shaping the decision-making process:
- Trades Look Back: This specifies how many historical trades the system examines to calculate performance metrics like profit factor and win percentage. For instance, if set to 50, the system will analyze the last 50 crossover trades to make an informed decision.
- Exit After Bars: This parameter defines how long the system monitors the trade after entry (in terms of bars or periods) before determining an exit. For example, if set to 5 bars, the system evaluates the trade’s performance after 5 periods, ensuring the trade is time-bound and not held indefinitely.
- Metrics : You can choose from several evaluation metrics to determine the signal’s reliability, such as:
- Profit Factor: The ratio of total profits to total losses from similar past trades. A higher value indicates a more reliable signal.
- Win Percentage: The percentage of past trades triggered by similar crossover events that ended in profit. A win percentage of 60% or more is typically considered strong.
- Average Performance: The absolute average gain or loss resulting from similar crossovers, regardless of direction (up or down). This provides a neutral measure of potential risk.
- Internal Profit Factor: It refines the traditional profit factor by calculating it as the sum of individual bar returns during a position, divided by the sum of bar losses, providing a more granular and realistic measure of performance.
- Performance Threshold: This sets a minimum performance level that must be met before the signal is confirmed. If the signal’s past performance doesn’t meet this threshold—such as a profit factor of 1.5 or higher—the system ignores the trade, filtering out unreliable signals and minimizing risk.
-
TS Max Bars Back is a parameter used exclusively for backtesting on the TradeStation or MultiCharts engine. This parameter must match the exact value set directly in the TradeStation or MultiCharts TS Max Bars Back setting.
How to Use Crosses Above Adaptive / Crosses Below Adaptive in StrategyQuant X
Importing the Block: A guide on how to import the snippet can be found in the Docs section here
After successful import you can use the new comparison blocks in :
Builder
In the Builder, you can enable this block under Builder / Blocks. When conducting blind datamining, it’s recommended to use the Avg Performance metric, which is non-directional and calculates the average absolute strength of a signal. The level of detail and specificity in the settings is up to each user.
AlgoWizard – Custom Blocks
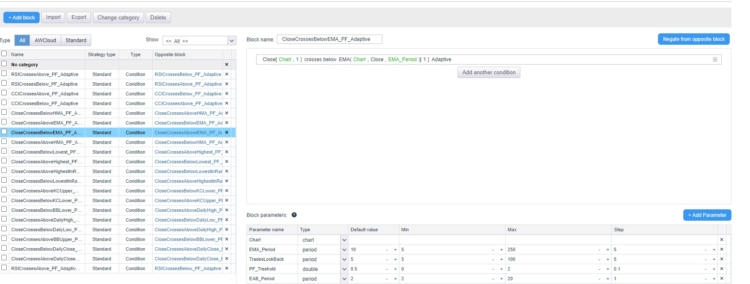
Custom blocks in StrategyQuant X allow traders to create personalized building blocks for their trading strategies without needing to code. These blocks can be used to define specific conditions, indicators, or logic tailored to the user’s requirements. Once created, custom blocks can be seamlessly integrated into AlgoWizard, StrategyQuant’s visual strategy builder, to build complex and adaptive trading strategies.
Custom blocks enhance flexibility by allowing you to parameterize key metrics like indicator periods, profit factors, and win percentages, providing more control over your strategy’s behavior. In summary, custom blocks enable more precise, dynamic, and sophisticated
Crosses Above Adaptive / Crosses Below Adaptive are blocks that are highly recommended for use in AlgoWizard as either custom blocks or cross-site templates. Because these blocks require careful configuration, it’s beneficial to create custom blocks where each setting follows a logical structure. While creating strategy templates is a slightly more advanced topic, these blocks are ideal for such advanced strategies. In the next article, we’ll provide a detailed tutorial on how to use them.”
For now, I have prepared several custom blocks based on this condition. You can download them using this
link and import them by following these steps.
AlgoWizard – Templates
This is a more advanced topic that we will cover in greater depth in an upcoming article. By combining custom blocks and random groups, you can create a prototype strategy and instruct SQX to search for specific types of strategies and maintain its adaptiveness.
Examples of Strategy Improvement
The following strategies are examples of how the Crosses Above Adaptive logic can enhance performance compared to the classic Crosses Above approach.
Original Without Adaptive Logic
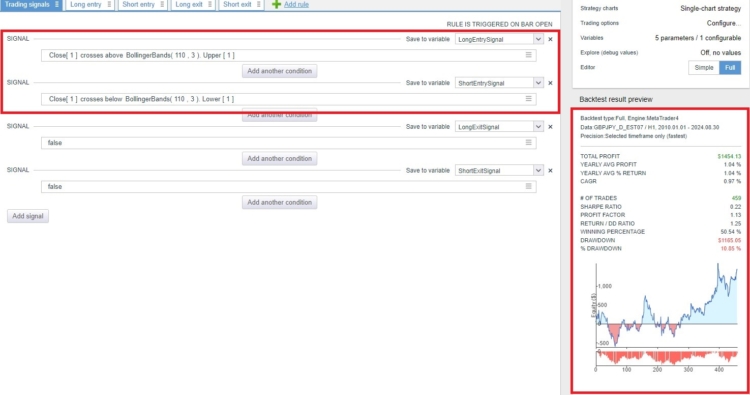
The strategy is based on breakout logic using Bollinger Bands, with an exit after 10 bars. In its classic setup, it shows positive performance but experiences long periods of stagnation and significant fluctuations in the equity curve.
Adaptive Logic Applied
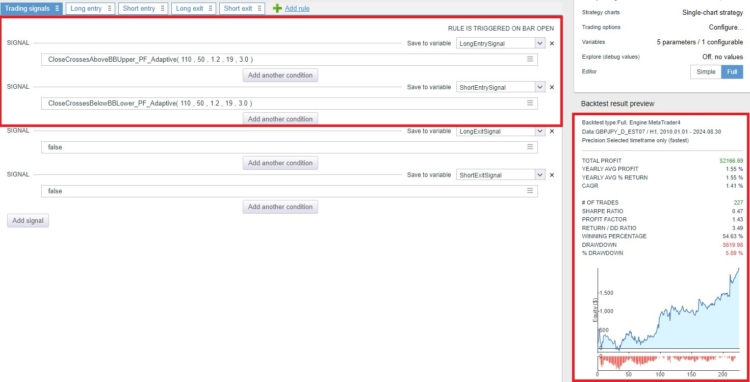
In the adaptive version, these large fluctuations are stabilized, and performance has dramatically improved.
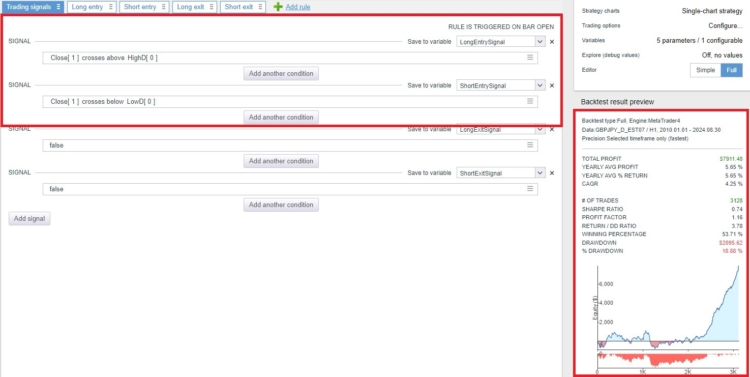
Original Without Adaptive Logic
This strategy is based on a breakout of the daily High/Low with an exit after 10 bars. Its performance has been good in recent years, but in previous years it was marginal. In other words, the strategy has been inconsistent over time.
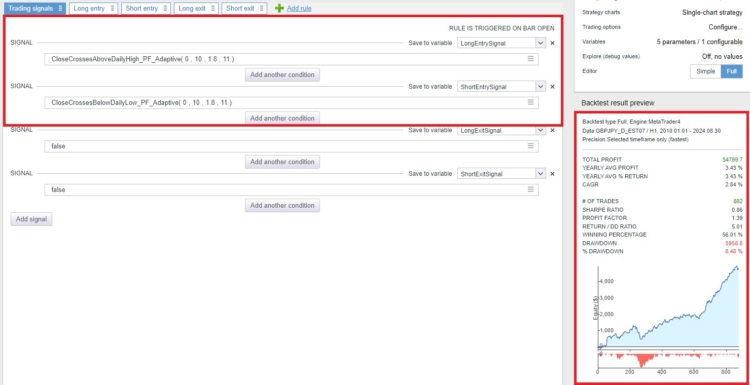
Adaptive Logic Applied
When adaptive logic is applied, the number of trades significantly decreases, resulting in a much smoother equity curve.
Both examples showcase strategies generated from custom blocks I prepared, which you can download here. I recommend using this block exclusively as a custom block. If you have indicators enabled in the builder and are using adaptive comparison blocks, I suggest setting the comparison block very conservatively, as follows.

Conclusion
This is just the beginning. There are several ways to extend this logic. For example, we can simulate buy/sell logic within the trading system, effectively performing a backtest within a backtest. Additionally, we can analyze the profitability of these rules across multiple markets simultaneously (yes, this is indeed possible!).
We welcome any feedback, comments, or suggestions for improving these snippets. In the near future, I plan to provide more snippets like these and eventually aim to integrate them directly into SQX.
These comparison blocks are implemented for MetaTrader 4, MetaTrader 5, TradeStation, and MultiCharts. You can download all the snippets in codebase here.



In principle, I find the idea of system improvements using custom blocks appealing at first glance. However, if I later want to run the strategy through the SQX improver, these strategies are rejected by the SQX improver. Thus, the advantage is only of limited duration until I want to automatically improve the strategies using SQX improver.
I hope that this, and a lot more such stuff will be integrated and fully compatible in the next versions of SQX. Many Indicators have clear Roles in professional trading.
SOme are for ENtry Point, some are for exit mostly, and some are to catch a trend.
It does not make sense to mix them in a purely random way in most cases.
Having more such intelligent rules builtin SQX, will prevent SQX from generating a large percentage of unusable strategies and help improve the results.
Especially for people with slower computers this will help a lot.
Yeah, I totally get what you mean, and I couldn’t agree more. Having smarter logic built into SQX would be a game-changer. Indicators aren’t just random tools—they each have a purpose. Some are great for entries, others work better for exits, and some help with trend identification. Mixing them randomly doesn’t make much sense and often leads to weak strategies that don’t hold up in real trading. If SQX could recognize and apply these roles more intelligently, it would cut down on the number of useless strategies and make the whole process much more efficient. And for people with slower… Read more »
hello, First, Amazing work SQx team! I love these adaptive comparison blocks. I am using this Adaptive Cross blocks into Algowizard to manually build my strategies logic to very good results so far. Thumbs up. Not used in Builder. Question: Are the performance metrics of the Adaptive Cross signals backtested with directional bias such as a “cross above” implies bullish buy signals, for example 3SMA Crosses Above 10SMA. Simply, It would return Profit Factor etc for buy scenario, right? But what if we want to use a 3SMA ‘Cross below’ 10SMA as a bullish Buy signal too? Does the Adaptive… Read more »
Hello Tony, Great, thanks for your response, I appreciate it. Let me answer your question. Custom blocks, as they are designed, have a bias. This means that when we use crosses above adaptive with an indicator, it inherently has a long bias. Unfortunately, this issue cannot be easily fixed afterward. The only way to remove this bias is by using non-directional metrics, such as average performance, which measures the absolute average movement after a signal—whether up or down. I also recommend looking into is above is below adaptive. These blocks provide even better results for me compared to crosses above… Read more »