</> Codebase - Indicators / Signals
StrategyQuant X platform codebase – a place to share coded customizations and extensions – among all users.
Indicators / Signals
Double Smoothed Stochastic Bressert
Double Smoothed Stochastics – DSS Bressert is an oscillator introduced by William Blau and Walter Bressert shortly after each other in two slightly different versions. The calculation of DSS Bressert values is similar to the stochastic indicator. The difference is the use of double exponential smoothing. The advantages over the classic stochastic oscillators are the fast response to price changes in a still very smooth pattern. In addition, the extreme zones at the other end of the scale are reached quite frequently, even in strong trends, resulting in many trend conforming signals. Double Smoothed Stochastics – DSS The Bressert values are the same as the stochastics – values above 80 indicate an overbought condition of the market, values below 20 indicate an oversold condition of the market.
clonex
oscillator
dss
inidcator
stochastic
Indicators / Signals
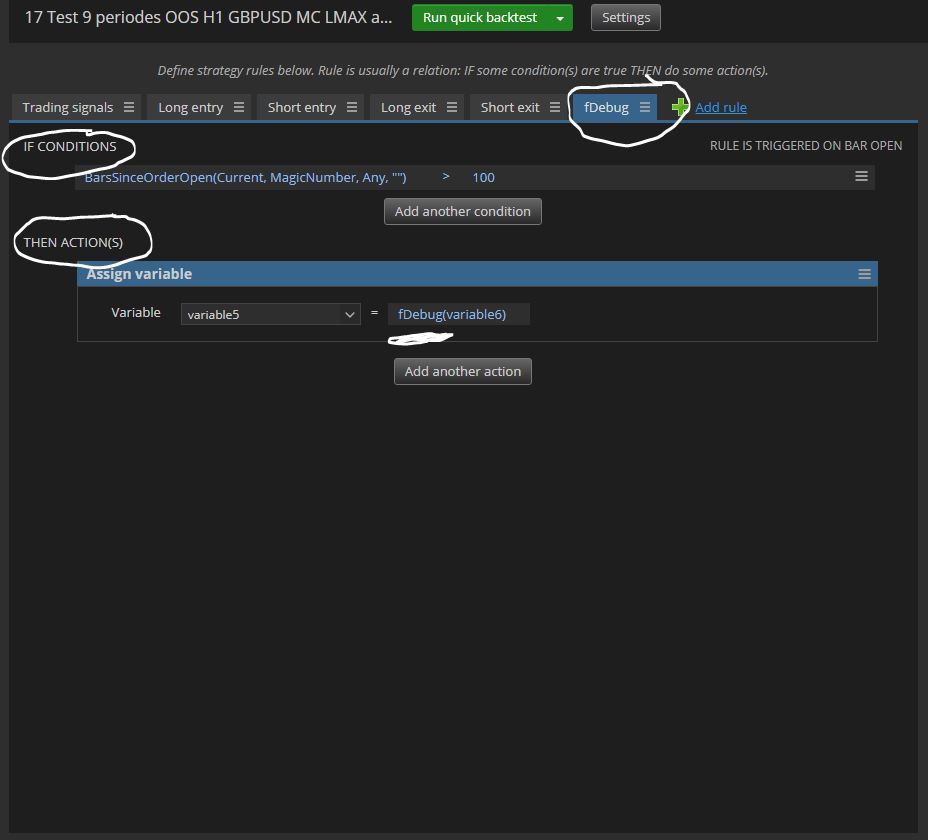
Debug a variable in AlgoWizard
If we create a template or run a strategy in AlgoWizard, we need, sometimes, to output the variable on a log to be able to debug it. Here is a function to output the variable to a log
Debug
Output Variable
AlgoWizard
Indicators / Signals
Detrended Price Oscillator (DPO)
Unlike other oscillators, such as the stochastic or moving average convergence divergence (MACD), the DPO is not a momentum indicator. It instead highlights peaks and troughs in price, which are used to estimate
oscillator
Detrended Price Oscillator DPO
DPO
Indicators / Signals
Choppiness Index
The Choppiness Index is designed to determine whether the market is choppy or trading sideways, or not choppy and trading within a trend in either direction. Using a scale from 1 - 100, the market is considered to be choppy as values near 100 (over 61.80) and trending when values are lower than 38.20).
choppiness index
range
indicator
trend
chop
index
Indicators / Signals
Entropy Math
Entropy Math indicator is based on Maximum Entropy Method.
disorder
Entropy Math
indicator
chaos
entropy
Indicators / Signals
CSSA Market Regime
This indicator is based on https://cssanalytics.wordpress.com/2015/03/13/using-a-self-similarity-metric-with-intraday-data-to-define-market-regimes/
cssa
market regime
chaos
similarity
Indicators / Signals
Volume-Weighted Average Price (VWAP)
In finance, volume-weighted average price (VWAP) is the ratio of the value of a security or financial asset traded to the total volume of transactions during a trading session. It is a measure of the average trading price for the period. Typically, the indicator is computed for a period of one day, but it can be measured between any two points in time.
price
volume
vwap
averafe
Indicators / Signals
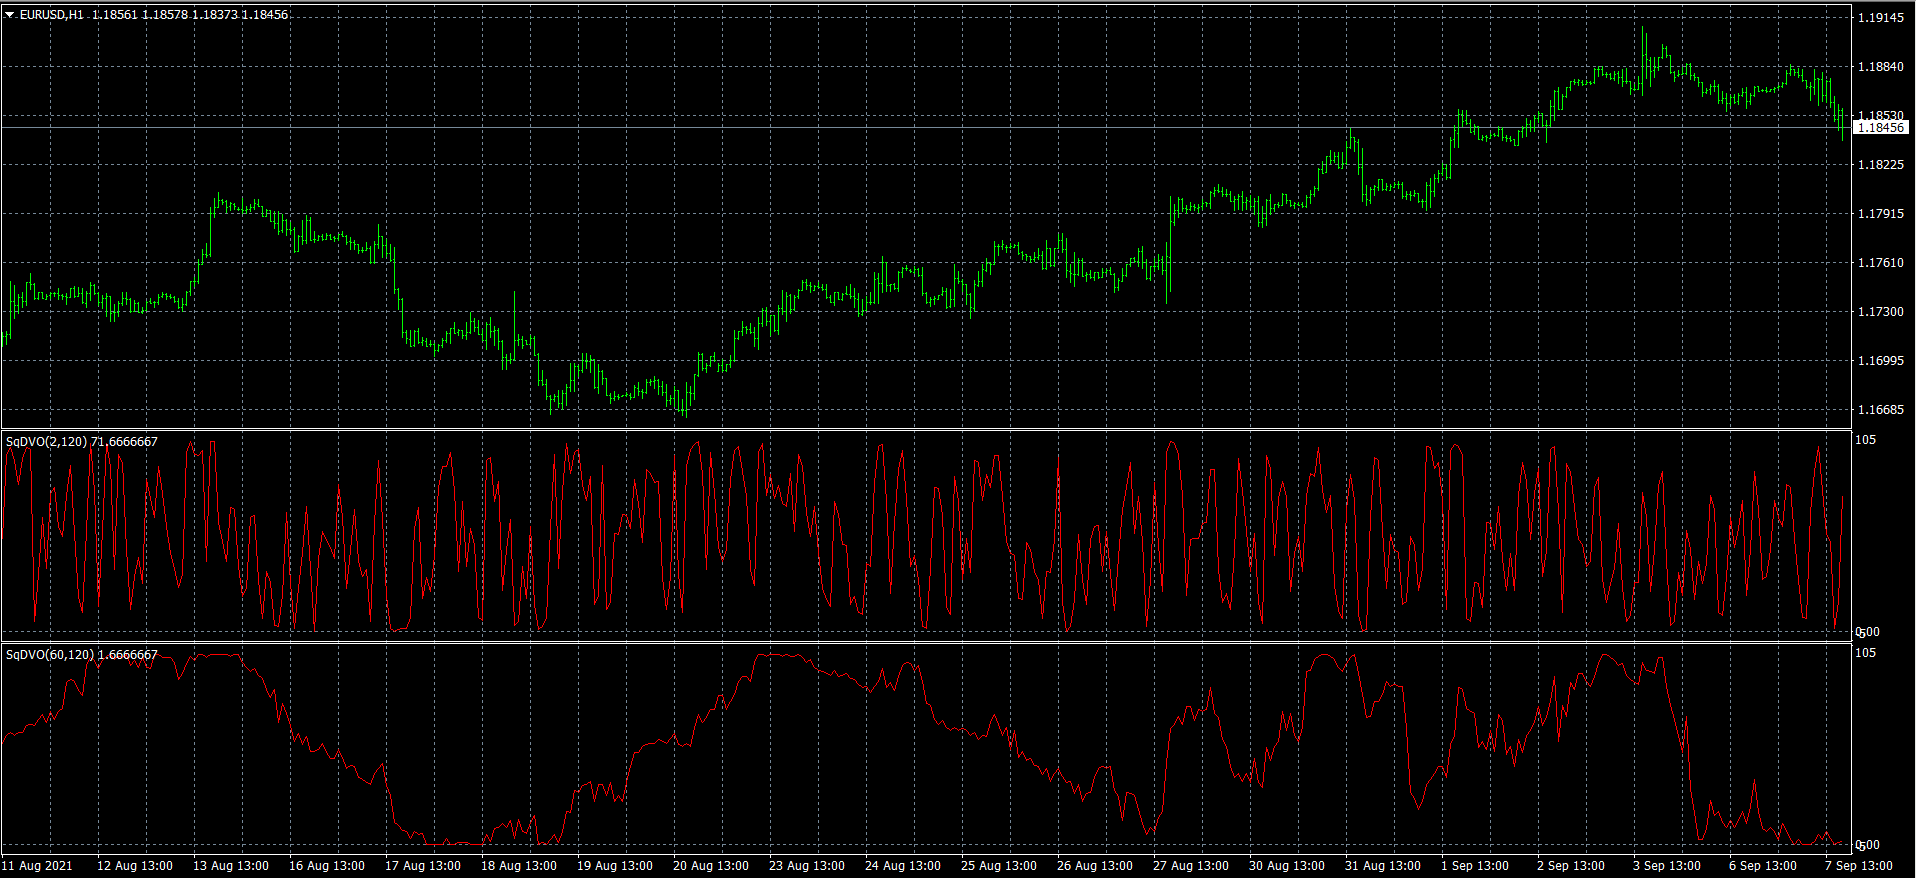
David Varadi Oscillator (DVO)
The Varadi Oscillator (VDO) is a leading indicator first proposed by David Varadi and originally aim to reduce the influence of the trend component in oscillators. The DVO can be described as a rolling percent rank of detrended prices over a certain lookback period. The detrending process used for the calculation of the indicator is based on the simple moving average of the ratio between the closing price and median ( hl2 ) price.
oscillators
david varadi
DVO
percentrank
Indicators / Signals
Money Flow Index (MFI)
The Money Flow Index (MFI) is a technical oscillator that uses price and volume data for identifying overbought or oversold signals in an asset. It can also be used to spot divergences which warn of a trend change in price. The oscillator moves between 0 and 100.
volume
MFI
money flow index
oscillator
Indicators / Signals
Double exponential moving averages (DEMA)
Double exponential moving averages (DEMA) are an improvement over Exponential Moving Average (EMA) because they allocate more weight to recent data points. The reduced lag results in a more responsive moving average, which helps short-term traders spot trend reversals quickly.
average
trend
moving average
snippet