Drawdown Analyzer
Page contents
The Drawdown Analyzer plugin let you see every drawdown period your strategy went through, ranked by severity, with the underwater equity curve and recovery times that the standard stats hide.
A strategy with a 15% max drawdown sounds tolerable. But did it hit -15% once and recover in two weeks, or did it spend three years stuck below water with five separate -10% pullbacks along the way? The aggregate number can’t tell you. This plugin does.
What it shows
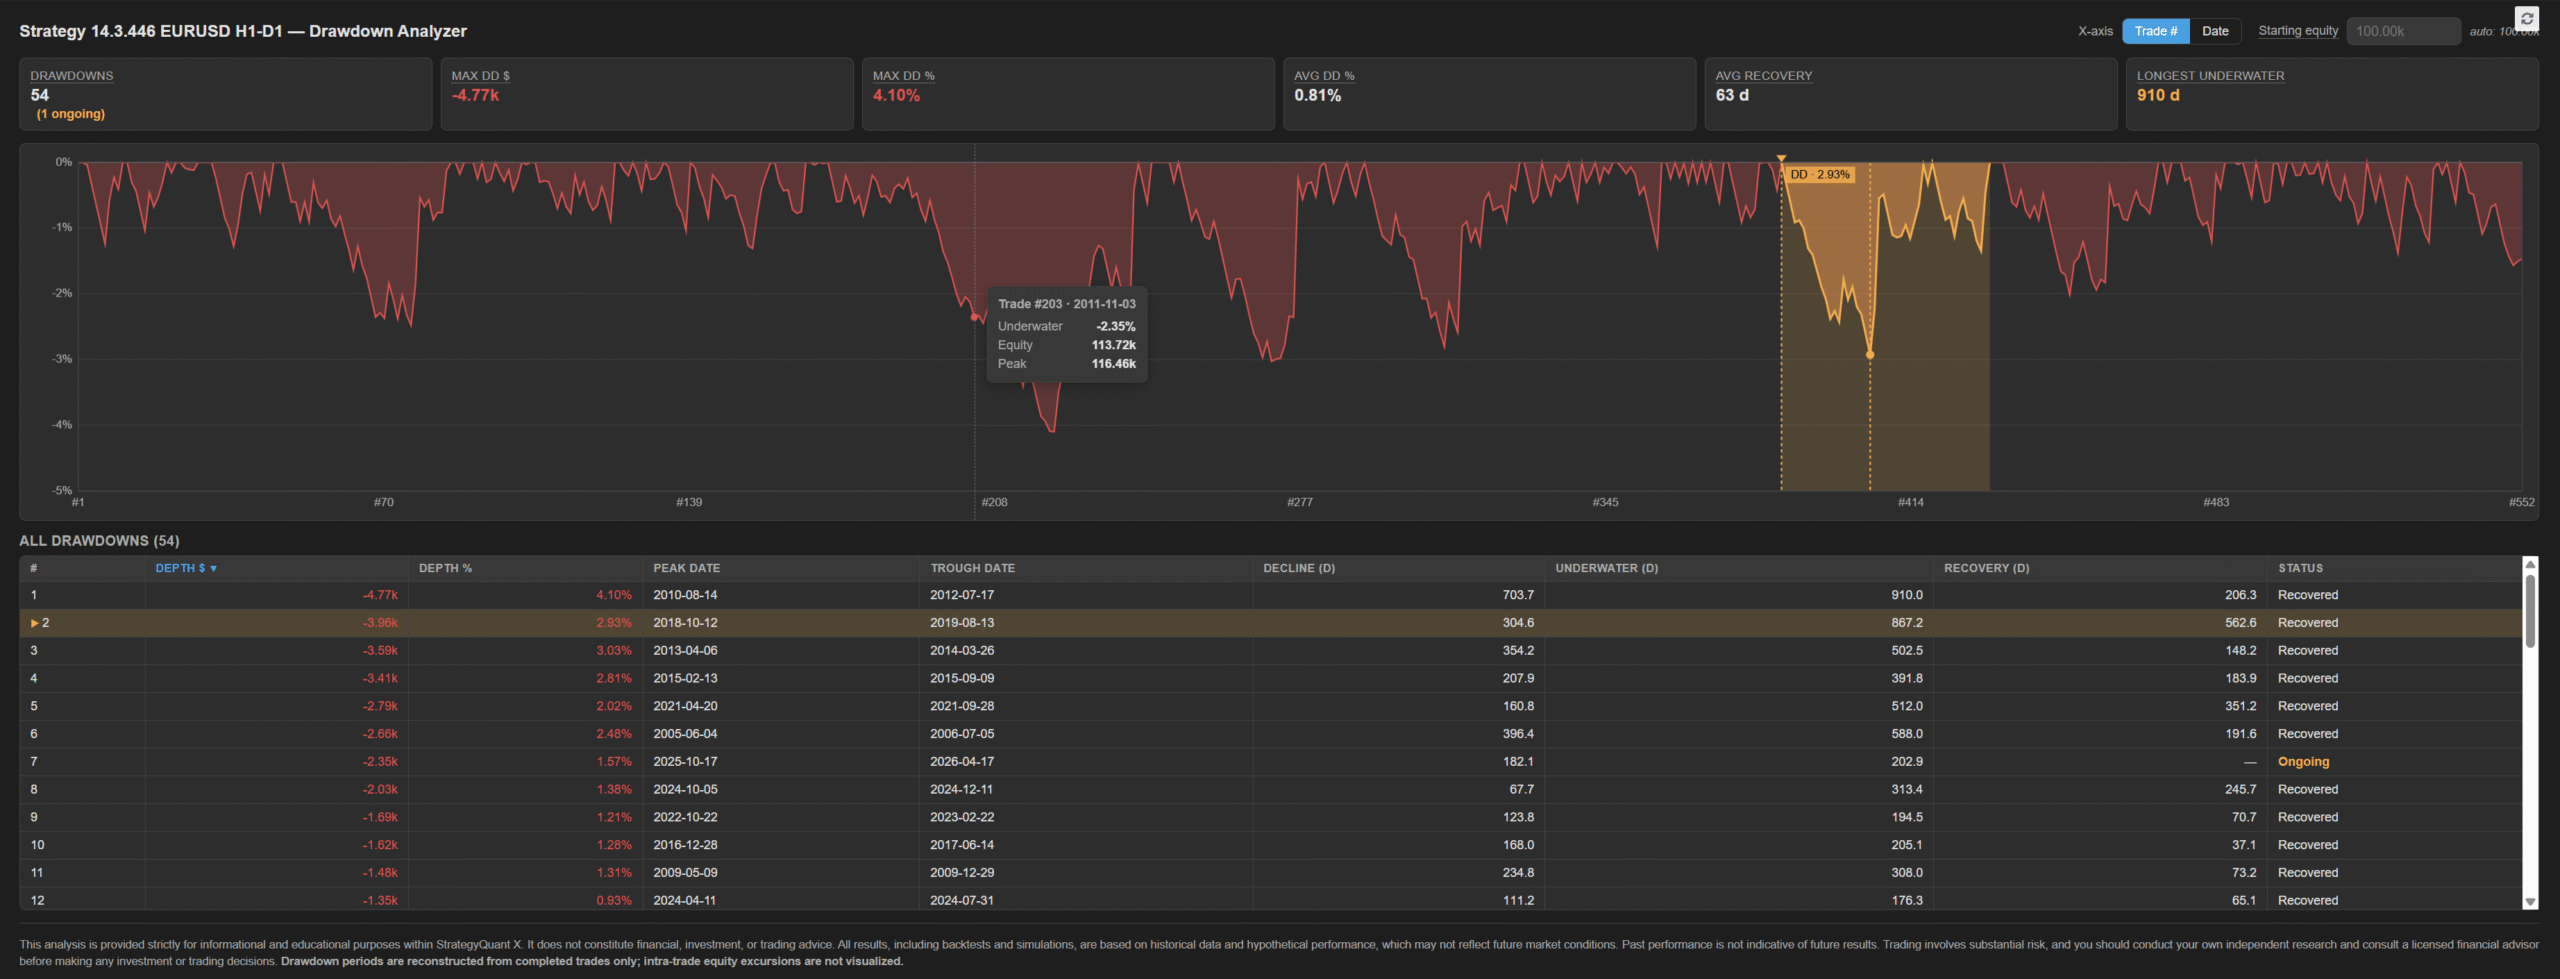
- Six summary cards at a glance: number of drawdowns (with ongoing count), max DD in account currency and %, average DD %, average recovery time, longest underwater period.
- Underwater equity chart — % off the running peak, painted as a filled area. Spikes show pain; the horizontal stretch shows how patient you’d have to be in live trading.
- Sortable table of every drawdown period — peak date, trough date, depth in $ and %, decline duration, total underwater duration, recovery time, and ongoing/recovered status. All numeric columns are click-to-sort with ASC/DESC toggle.
- Click any row to highlight that drawdown on the chart — warning-coloured band between peak and recovery, dashed verticals at peak and trough, marker symbols on both extremes, and a small label with the depth %.
- X-axis toggle between trade index and calendar date.
- Configurable starting equity — auto-detected from the order’s Balance field (the value SQX actually used in the backtest), with an override input for what-if sizing analysis (e.g. see how the same trades would have hurt on a $50k or $200k account).
How to read the numbers
- Max DD $ / Max DD % — the deepest single drawdown. The realistic worst-case pain you must survive to trade this system live.
- Avg DD % — average depth across all drawdown periods. A high average means even routine pullbacks are deep, not just the worst one.
- Avg Recovery — average calendar days from trough back above the previous peak. Long averages signal slow comebacks even after small dips.
- Longest Underwater — the most calendar days the account ever spent below a prior peak. This is the patience your live deployment must have.
- The table reveals whether one giant drawdown dominates the picture, or whether the strategy is consistently bumpy. Sort by Underwater (d) to find the most psychologically demanding periods, not just the deepest ones.
Installation
- Download the plugin folder.
- Copy Drawdownanalyzer/ into [SQX install]/user/extend/ResultsPlugins/.
- Restart StrategyQuant X, or click the reload icon at the top-right of the Results tab.
- Open any strategy and click the new DrawdownAnalyzer tab in the Results area.

Please login to comment
0 Comments
Oldest