PAR and AWO Indicator :(
21 replies

Loz
10 years ago #111935
My trades are opening at wrong times, and when they do open, they keep opening new ones after the first one has been closed 🙁 I didnt want it to do that.
How do I get the PAR to look at the CLOSE of the candle. ie, the last PAR dot, if on next bar candle closes below the PAR dot, go short… BUT, to check the AWO indicator to see where the bars are at… I need to differentiate the two colors and whether or not its above 0 (the vertical scale) or below it. and vise versa…
How do i do that on this software?
cheers
Loz

jimasks
10 years ago #123593
Could you post your .sqw file? Then we can look at and see what you are doing. From that I would hope we could help you out.
Loz
10 years ago #123594
I dont have one bud… I just need to know what I need to do to do it. 🙂
Nothing on this site, tutorial wise helps me much 🙁
I guess i could create one…
brb
Loz
10 years ago #123595
jimasks
10 years ago #123605
wow your sqw file is very simple.
I am guessing at what you would like.
It seems that you want to enter a trade when the PAR switches from one side of the price to the other while the OWS in above/below the price. For example, if the PAR switches from being above the close price to below the price, and the OWS is below the closed price then you would try a long trade. If I am getting that right, then you would might want to use the test; crosses above, and not if it just above.
With that assumptions I have tried several things in the included file.
I made two additional buy tabs. I have disabled your original buy with the condition 0 0. So that tab will still be present, but will not ever be taken.
In the new tab, “buy Altern1” I added the crosses below function. In other words, I am asking the question did the PAR indicator switch from being above the last closing price to now being below the current price. This is a great function to help the program to detect when there was a switch and not just when it is above or below.
Add to that I also added the function to do that only on a new candle. That is; did the PAR switch from being above the last candle close to being above the current open. (When the candle first opens the “Close” is the current price, which will be the opening price.)
Just to make sure I was remembering how to use the Parabolic SAR right, I looked on youtube and found this short video on how to use the SAR;
https://www.youtube.com/watch?v=1GWCuQ_AYZw#aid=P-WhdHGxOA8
Mind you, I am not endorsing or even suggesting it be used this way or not, but just to see if I could get it to work the way the video said, I make another buy tab; “but Alter2”. In this tab I test to see of the PAR switched from above to below three candles ago and then make sure the last two were also below. Also if the AWO was above as well (something not in the youtube video, but was from you requirements).
if the condition was true, then close any sell trades and enter a long trade.
Again I didn’t test this but I think all of this should give you an idea of how to use the functions and such.
Please use my suggesting and see if you can get it to do what you would like and report your result.
Jim
jimasks
10 years ago #123606
Hey, while I was looking the youtube on PAR I spotted a method with P-SAR and ADX (Average Directional Index). https://www.youtube.com/watch?v=ISR_dr0W4QU (Again I have no idea if this trading method is good or if it is I don’t know under what market conditions.)
I thought this maybe a good example to follow of how to handle a number of things that you will most likely want to do next. (guessing on my part).
It triggers on two conditions of the ADX and on a condition for PAR. It also allows for the condition to take an entry if the trade occurred within the last three candles.
It has two profit levels (TP1 and TP2). If TP1 was hit then TP2 part has the stop loss set to break even. Exits on trades when an other signal is encountered.
Their could be a very small condition that could be not wanted and that is if a trade is stopped out while one is still getting a entry in the same direction and with the last three candles of the current candle. I don’t think this is very likely to occur, but it is possible.
Check it out and study it. I would think it could be used in what you are wanting to do next.
Jim
PS any comments are welcome
PSS also I didn’t verify the full functionality. If Someone would that would be kind of nice.
Loz
10 years ago #123608
Hey Jim
WOW, thanks bro for the huge effort to help 🙂 Most appreciated.
The Shift thingy, what is that, I thought it was a chart shift… I’m guessing it’s to count candles?
And the crosses above function, I thought that was for moving averages only, when one crosses above or below the other?
Is it to just say, when an element ends, ie, PAR for instance, when the dot changes / reverses and the candle (shift 1)?
I’m not entirely sure what that does…
See, this strategy is simple.
The PAR dots, when they end, they switch from being at the top of the candles to below.
Obviously, as the candle develops, it overlaps one of the PAR dots, then disappears if the close of the candle exceeds it, then a dot is placed on the other side of the candle, if you follow me?
OK, that’s condition 1…. next condition is to look at the AWO Indicator… now there are two colors, one to show an upward movement, and one to show a downwards movement of price / volume.
It’s important that:
If a sell signal comes in:
a) candle closes below the PAR dot.
b ) that candle that closes below the par dot shows a downward momentum on the AWO, in this instance i have colored mine blue for up, and red for down. once those conditions are met, then execute a sell trade. and vice versa
I’ve done a short video to explain how this works.
http://www.fileswap.com/dl/skuDISCfC1/
BTW, i checked the strategy tester on the par u created, unfortunately, doesn’t work 🙁
Cheers
Loz 🙂
wow your sqw file is very simple.
I am guessing at what you would like.
It seems that you want to enter a trade when the PAR switches from one side of the price to the other while the OWS in above/below the price. For example, if the PAR switches from being above the close price to below the price, and the OWS is below the closed price then you would try a long trade. If I am getting that right, then you would might want to use the test; crosses above, and not if it just above.
With that assumptions I have tried several things in the included file.
I made two additional buy tabs. I have disabled your original buy with the condition 0 0. So that tab will still be present, but will not ever be taken.
In the new tab, “buy Altern1” I added the crosses below function. In other words, I am asking the question did the PAR indicator switch from being above the last closing price to now being below the current price. This is a great function to help the program to detect when there was a switch and not just when it is above or below.
Add to that I also added the function to do that only on a new candle. That is; did the PAR switch from being above the last candle close to being above the current open. (When the candle first opens the “Close” is the current price, which will be the opening price.)
Just to make sure I was remembering how to use the Parabolic SAR right, I looked on youtube and found this short video on how to use the SAR;
https://www.youtube.com/watch?v=1GWCuQ_AYZw#aid=P-WhdHGxOA8
Mind you, I am not endorsing or even suggesting it be used this way or not, but just to see if I could get it to work the way the video said, I make another buy tab; “but Alter2”. In this tab I test to see of the PAR switched from above to below three candles ago and then make sure the last two were also below. Also if the AWO was above as well (something not in the youtube video, but was from you requirements).
if the condition was true, then close any sell trades and enter a long trade.
Again I didn’t test this but I think all of this should give you an idea of how to use the functions and such.
Please use my suggesting and see if you can get it to do what you would like and report your result.
Jim
Loz
10 years ago #123609
Cheers, unfortunately I can’t even comment what you did there, that’s way too advanced for me to even understand how and why they are structured like that…
where did you get all this info to learn how to all this, while the rest of us struggle to understand? Is there some secret manual we don’t know about 😉
Loz
Hey, while I was looking the youtube on PAR I spotted a method with P-SAR and ADX (Average Directional Index). https://www.youtube.com/watch?v=ISR_dr0W4QU (Again I have no idea if this trading method is good or if it is I don’t know under what market conditions.)
I thought this maybe a good example to follow of how to handle a number of things that you will most likely want to do next. (guessing on my part).
It triggers on two conditions of the ADX and on a condition for PAR. It also allows for the condition to take an entry if the trade occurred within the last three candles.
It has two profit levels (TP1 and TP2). If TP1 was hit then TP2 part has the stop loss set to break even. Exits on trades when an other signal is encountered.
Their could be a very small condition that could be not wanted and that is if a trade is stopped out while one is still getting a entry in the same direction and with the last three candles of the current candle. I don’t think this is very likely to occur, but it is possible.
Check it out and study it. I would think it could be used in what you are wanting to do next.
Jim
PS any comments are welcome
PSS also I didn’t verify the full functionality. If Someone would that would be kind of nice.
jimasks
10 years ago #123621
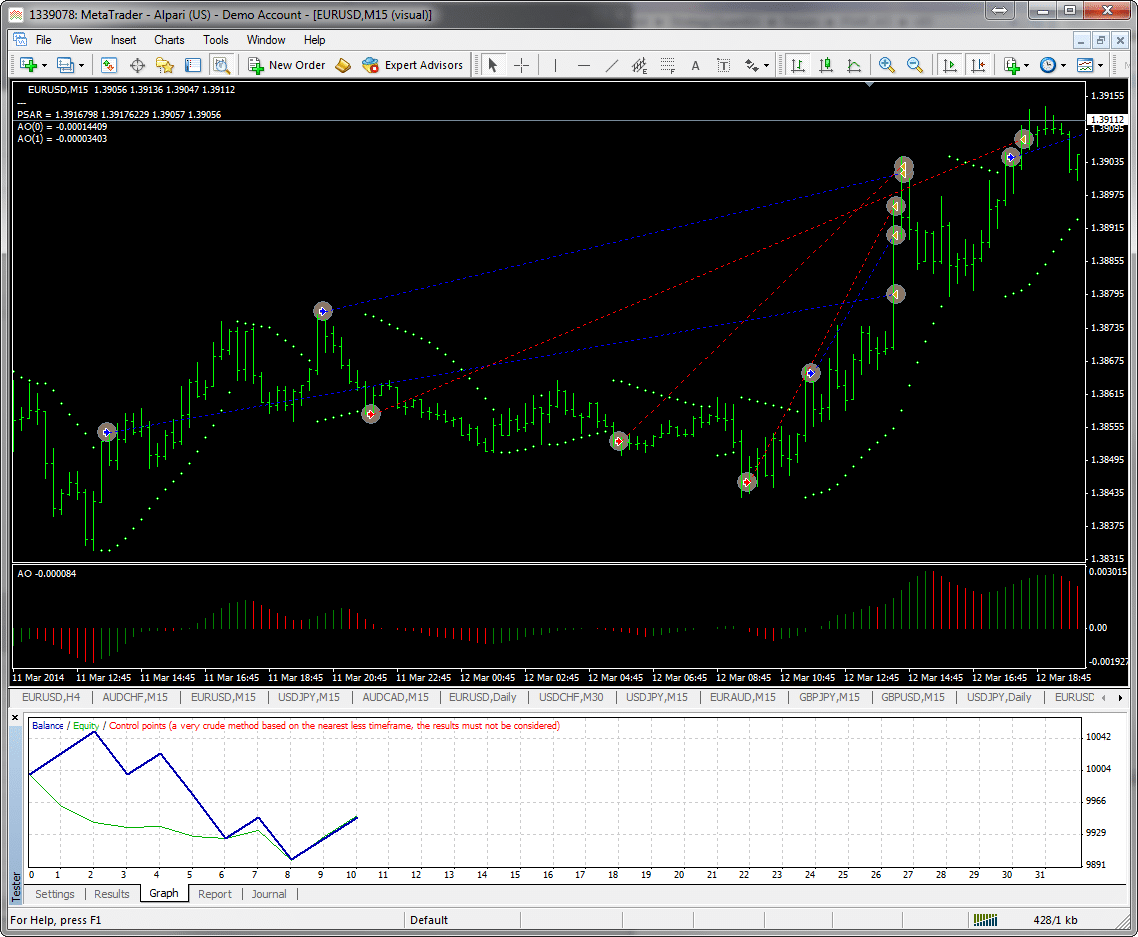
Hey, Sorry about not checking my own work. I guess I was to confident. So, I checked and now it does take entries. I didn’t do any optimizing or anyting so the the setting are default.
So, this EA takes trades on meeting two conditions;
– PSAR switched across price (buy: PSAR switches from above to below and sell: switches from below to above)
– Awesome Indicator is the same direction as the trade will be (green for a buy, red for a sell)
Also your questions:
1. do I need the IsBarOpen? Well, no, but it depends on your strategy. For entries that follow some indicator I often do it this way because the indicator change change during the candle formation and then switch back before the candle closes. So, in reviewing the charts one only sees the result of closed candles. I want to have my EA trade the way the chart will look a time later. The only way to do that is to check for entries is when a new candle opens.
2. What is this shift thing? Yes, you are right that refers to the candles back. It start with the current candle as zero and counts backwards. So, candle 1 is the first candle after the one you are currently on.
– Consider the code for the Awesome Osc. I compare the price of the current AO value (AO[0]) to the one before it (AO[1]). Then I ask the question is it increasing or decreasing (for a buy or sell conditions, respectively).
3. added some text to show the values of PSAR and AO and price in the upper right corner. I used this for debugging.
Also, I did somethings that you didn’t ask for.
– I put in a TP (default of 250 pips)
– I also assume that you will want to close a trader before taking an other trade in the opposite direction. I placed the close trade before the open a new trade, because in the US hedging is not allow. If I tried to do it in the other order it would not open a new trade…
– I moved the parameters to be accessible when the EA is started. This includes having PSAR parameters available, and the Trade lot size and initial TP. I didn’t up in a stoploss, but it may make since to use the last value of the PSAR as the SL. This would require putting in another couple of tabs to manage the stop loss. I can do that if you would like just as an example.
Here is a short video of what I just showed and how it works.
http://screencast.com/t/XMyhwMQReE
Lots of luck with this and let me know how well it works for you.
I hope you understand that I am doing this as an aid to learning how one can use this powerful program.
Jim
PS. it took me longer to write this response and to make the video then it did to make the EA. Just got to love Strategy Quante! (Thanks Mark).
Mark Fric
10 years ago #123636
I simplified the strategy, I think this is the correct version, unless I missed something from the video.
I’ll try to explain it point by point for Long rule:
and Is Bar Open is True <- it means we are checking for signal only at open of a new candle, not on every tick
and Market Position is not Long <- we won't do anything if Long trade is already opened
and ParabolicSAR(…)[1] < Close[1] <- PSAR is below Close on previous candle
and ADX(.., Main)[1] > ADX_Theshold <- main ADX is bigger than 20 on previous candle (ADX_Treshold is configurable, it has value 20 in this example)
and ADX(…, +DI)[1] > 20 <- +DI is bigger than 20 on previous candle
and (
ADX(…, +DI) [1] crosses above ADX(…, +DI) [1] <- +Di crosses above -DI on previous candle
or ADX(…, +DI) [2] crosses above ADX(…, +DI) [2] <- +Di crosses above -DI 2 candles ago
or ADX(…, +DI) [3] crosses above ADX(…, +DI) [3] <- +Di crosses above -DI 3 candles ago
I tested it, and the EA is not really profitable in the long run according to backtest. Of course it depends also on SL/PT used.
Mark
StrategyQuant architect
Loz
10 years ago #123643
Cheers Jim, nice work… 🙂
I just ran a backtest on the EA, i noticed that some trades are being opened when the condition doesn’t meet true. ie, long, the candle didn’t close above the PAR, or short candle didn’t close below the PAR…
also, I don’t use a US Broker, I always trade offshore, so ideally need that taken out.
Cheers
Loz
 jim-par.gif
jimasks
10 years ago #123644
Goodness me. I relooked at your video and you so carefully outlined what you wanted in your video, but I got it wrong. Now I think I got what you want for the entries.
So, we have a new version enclosed.
The thing left to do is to define how to exit the trade. Both for the take profit and stop loss. Currently there is no stop loss and I have a default take profit of 25 pips or when an opposite signal is encountered, just for checking.
Also are you interested in two take profit levels? If so, what would the rules be?
I hope this helps. Again, sorry that I didn’t listen carefully the first time.
Jim
Loz
10 years ago #123671
Cheers Jim – sorry for the late in replying’ i’m in the middle of moving house.
I noticed that it wont open more than one trade in anyone direction, or even hedge 🙁
Ideally it needs to take on all the possibilities / opportunities it comes across.
As to an SL, I think something like 50 pips, with a Trailing Step incorporated, with option to set it to true or false to activate the trail step, also with # of pips to start the trail step and to move every X amount of pips.
ie
TrailingActivated: True
TrailingStep: 10 // when to start the trail step
TrailingIncrements: 1 // how often to move the trail step after activation
Cheers
Loz
jimasks
10 years ago #123674
Ok, I have tried to get the requirements as you asked, despite my State-side bias (no hedging and FIFO). Sorry about that.
I added;
– entry in any direction and at any time for a buy or short as long as the qualified requirement was encountered. (hedging and no-FIFO now allowed).
– Added stop trade management: Initial stop loss and trailing stop loss with a logic switch to control the trailing stop functions.
I did this by adding new variables that a user can input at start up. (I hope they are somewhat understandable by their names). If they are confusing I can try to provide docs. Also I hope you will study the code to see how some of these requirements were met. Took a little problems solving, but not much.
I counted on Mark’s wonderful software to enable all of the trade management to work; and it does!
I verified the trade entry, hedging, and non-fifo requirements. I verified the TP and initial SL conditions, but didn’t view the trailing stop loss management. I verified that all the trades were handled independently by SQ code (Now wonderful is that!! — Thanks again Mark!).
I did this by removing the “if trade is flat” requirement and giving a new magic number to each trade. (see the sqw files for the buy and sell).
This was done with only three tabs….
I hope you have a chance to look at this.
It was my goal to do all of this coding and simple verification under 30 minutes, and I easily hit that goals. What a great program Mark has written.
You will find an image show the hedging and non-fifo trading for a combination of buys and sells.
and you will find the sqw and mq4 files.
please let me know if we are getting closer to what you would like.
I hope your moving goes well.
Jim
PS. There are some warning:
– if the trade station is shut down while trades are active, they will NOT be managed if the trade station is restarted. Most of the EA’s I have written will operate correctly even if they are turned off and then back on but this one will not. However, the SL & TP levels will still be active in your broker’s log.
– parameters need to be adjusted to make this profitable, but i would expect that be your work.
– US accounts will now allow this kind of trading except for a two US brokers, that I know of. (warning to other people).
– I didn’t find out how many trades could be open, either by SQ or MT4/broker.
– I didn’t verify the trailing stop functionality.
 PSAR_OA_working.png
 PSAR_OA_working.png
Loz
10 years ago #123757
Cheers bud…
what are these?
TrailingSLstratAfter_Pips (checked)
TrailingSLincrements (checked)
TrailSLStep_ifActive (unchecked)
TrailSLinc_ifActive (checked)
I dont understand why there are 4 of these, i figured 3 was all that was needed?) ie:
TrailingActivated: True
TrailingStep: 10 // when to start the trail step
TrailingIncrements: 1 // how often to move the trail step after activation
Cheers
Loz
(almost moved, just gotta put things away now 🙁 )
Loz
10 years ago #123758
P.S
I don’t think the trail step stuff works, its not moving the SL closer to the entry of the trade once it hits 10 pips, and the trail-inc doesn’t move by 5 thereafter. 🙁
Loz