How to create EA to use with Trend Bar Ribbons
3 replies

donnydon
11 years ago #111944
Hi,
I have recently purchased the Strategy Quant EA Wizard, I would like to know how to create an EA wizard that does the following:
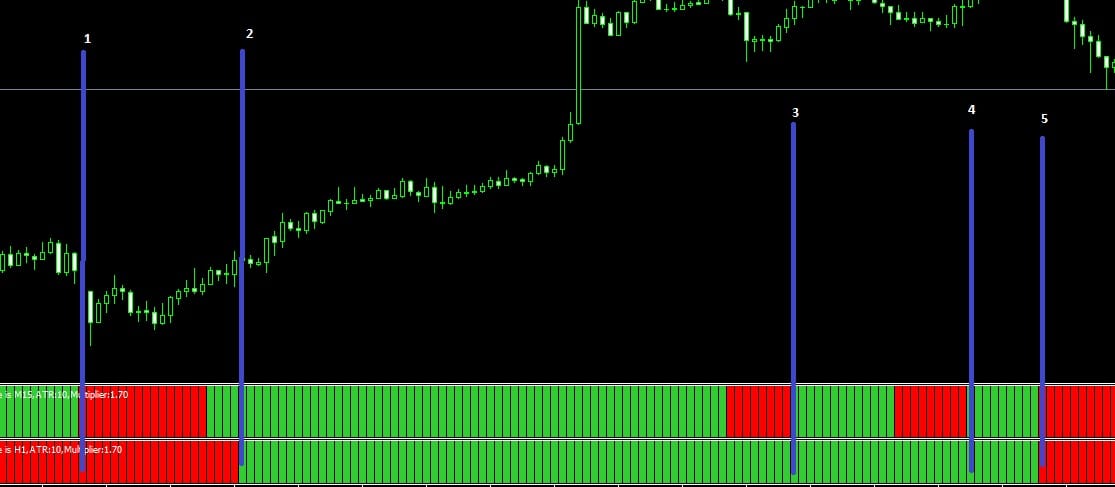
1. I am using the AUS/USD pair on a 15min chart and I have 2 Trend Bar Ribbons Indicators on my chart, 1st Trend Bar Indicator looks at signals on the 15min chart and the 2nd Trend Bar Indicator looks for signals on the 1hour chart. The Trend Bar is green/red (green for buy and red for sell
2. I have attached an example of my chart.
I have drawn blue lines for 5 possible signals.
Basically when both Trend Bar Ribbons are the same colour I look to open an order. So if both Bars are green I will enter a buy trade and if both Bars are red I will enter a sell trade. I only want to enter a trade when both Bars are the same colour and then use stop loss/profit target of 32 pips to close the trade.
Also I only want to enter a trade if both Bars are the same colour on the 1st bar but I dont want the EA to keep opening trades if the next Bar is the same colour and so on.
Can someone please help me create an EA for this.
Kind Regards
Donato
 bar.jpg
jimasks
11 years ago #123645
I will try to give you a hand, but it is a little hard without knowing how your custom indicator is displaying it’s info.
There are a number of things you will have to do.
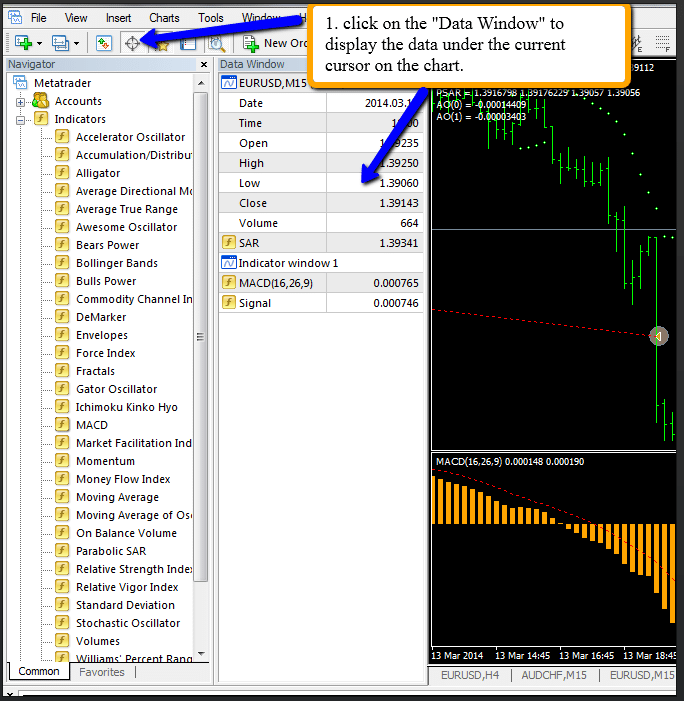
1. Figure out how your Trend Bar Ribbon is displaying the data on the MT4 chart. This can be done using the “Data Window”. The “Data Window” can be brought up with the button shown in figure 1, or use Ctrl_D. This bring up all the data available on the window that is on the current bar where your cursor is on your chart. Ok, move your cursor to the chart and the data window will read all of the data in the chart. In figure 1, I am showing the price data and two indicators. (It shows: date, time, open, high, low, close volume: SAR :MACD(16,26,9), Signal.)
I choose the MACD on my chart because it shows two values for the one indicator ( have witten a indicator with 8!). I am guessing you will see something like that: one for Green and one for red; and you will see these values for each of your two Ribbons indicators. Look at the values for the green bars and red bars. Again, I am guessing, but knowing how some indicators are written, I guessing you will have something like Trend Ribbon and Red (or Green) for the first and second values, respectively. These values will most likely change between 0 and 1 or blank and 1. Again, just a guess. If this is not understandable, then capture an image with the data window is up and the cursor is someplace over the active chart. (also it may be on your image, but with this editor for the forum, I can’t see it anymore. when I finish this message, I will look again and If I can make it out I will post a second message.)
Ok this is a little complex. If you could make a video, I could help better. I use a free program called Jing that allows me to post videos off my screen, with video and audio, and posts a link that anyone can view. Look here; “http://www.techsmith.com/jing.html” Please note I have no connection with Jing and I am not doing anything more than suggesting a way that works for me. If you have any other way of posting a video, that would be ok too.
2. Once you have a good understanding of your Ribbon indicator, you will have to install your custom indicator into the SQ. I found Mark’s explanation very straightforward. Please read the online manual. (** Thanks Mark for making the feature available!)
Look here: https://strategyquant.com/eawizard/tutorial_custom_indicators
3. building up the logic: this is a little bit of an issue because one needs to understand the reading of the custom indicator you found in step 1. The basis of this step is to find the first time both ribbon indicators turn the same color, then make an entry. Once the entry is made, lock the program out from taking any additional trades until the current trade is finished and continue until the exit condition is made. The start looking for the next entry.
Of course, there are a number of ways to do these steps. For example, for a long, one is asks were the colors not both green, but now are both green? and are their currently no trades active in the direction I want to trade? If true, then enter a long trade, if false, then wait for the next entry signal.
Likewise, for the short.
After that then one needs to define the trade exit rules and place them into the logic. Mark has made this easy-ish with several of his functions. Look at the Trade entry rules and focus on the Take profit and stop loss. If the exits are dynamic, (namely not at a set number of pips or a set price level), then there a number of functions one can either close the trade outright (or partially close) or reset the Take profit / Stop loss values/prices.
Seems like the big issue is to understand what your custom indicator is doing and how to install it into the SQ. After that the trading logic can be simply defined and quickly built. Really, with SQ it can most of the time built reasonably quick.
Hope that Helps, but it is a little hard without knowing how your custom indicator is putting the information on the chart.
Jim
 CustomIndicatorPicture.png
Viewing 1 replies (of 1 total)