WF Matrix Results
0 replies

toddone46
9 years ago #113493
I seem to be working through the entire SQ process fairly well, learning and improving along the way. I have gotten tripped up a bit in the WF Optimization and the WF Matrix Optimization as far as setting the parameters for pass/fail properly, and interpreting the results properly.
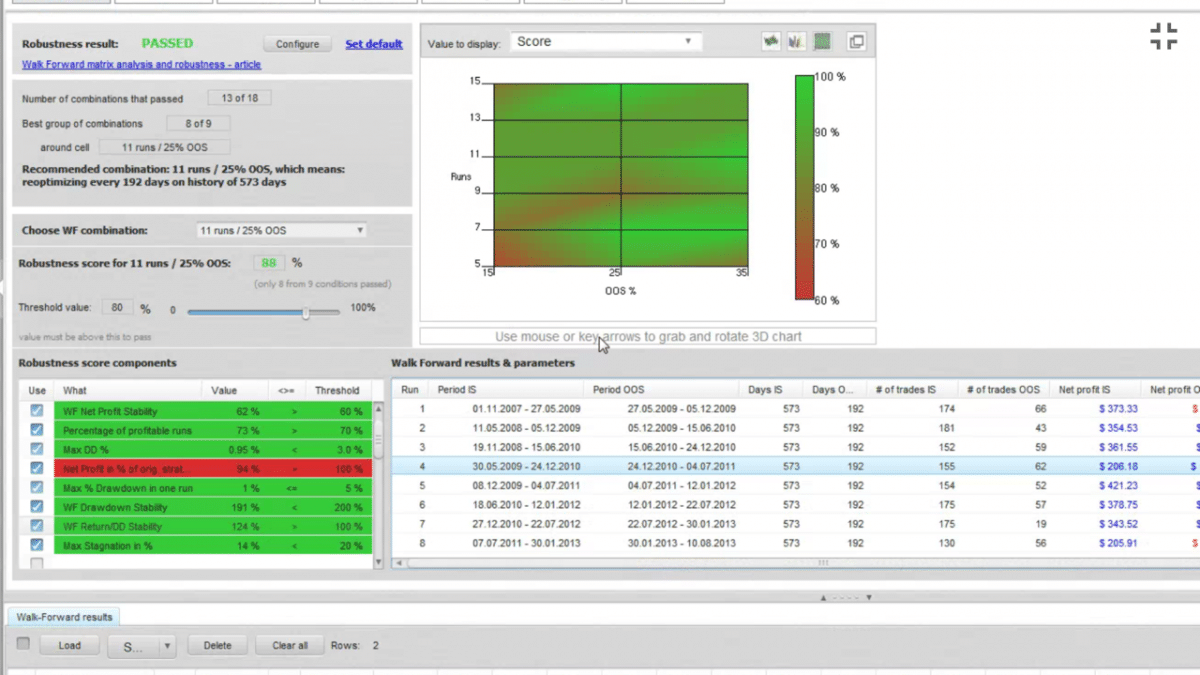
Please see the attached samples of a strategy that I believe is decent. There are three problems though:
1) the 3D charts look to have sharp moves on them which is a sign that it is not really as robust as the test scores reflect. Am I interpreting the attached 3D chart right?
2) I’m not sure my parameters in the attached pics are valid for determining a good robust strategy (too strict, too loose, irrelevant?)
3) Even after all this testing, when I brought back the testing year from 2007 to 2003, it was essentially stagnate the entire 4 years which tells me it was curve fitted for a specific period in time even though I used rigorous OOS methods along the way; or, it’s just that the strategy needs to constantly be reoptimized to perform properly with current market conditions, which is in line with the WF Matrix results since it tells me I need to reoptimize approximately every 6 months.
Also, I run tests based on .01 lot size. Any feedback would be appreciated.
Thanks,
Todd
 IMG_2660.PNG
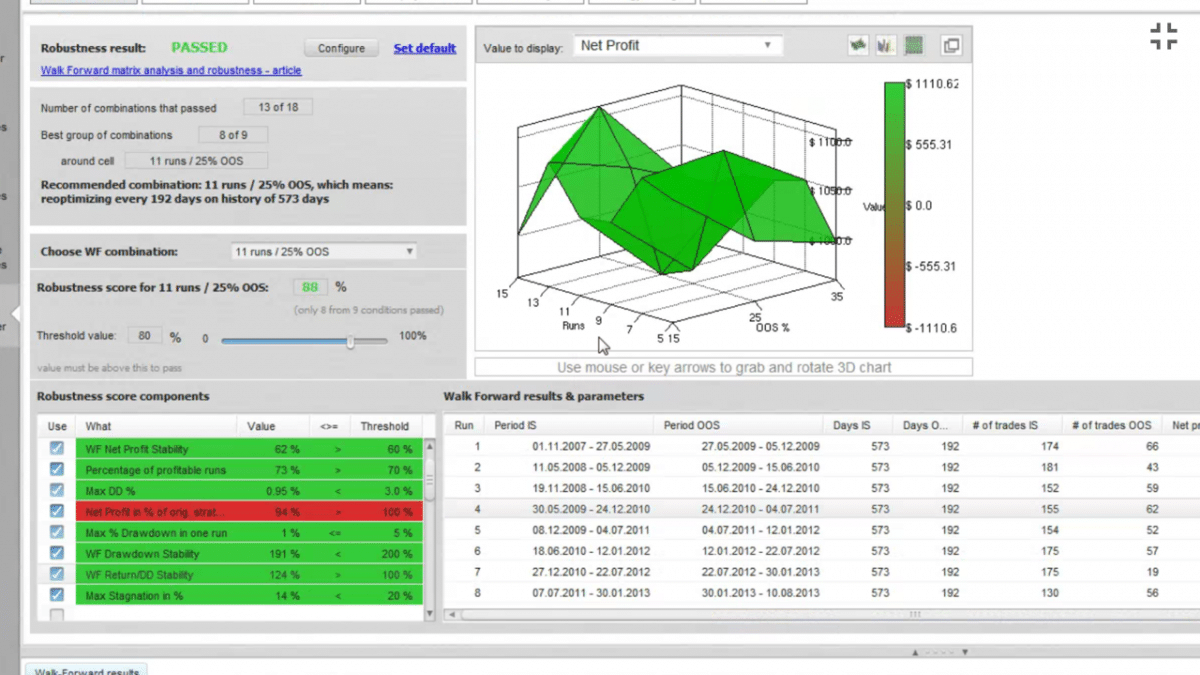 IMG_2661.PNG