Clone Army is a fully automated algorithmic trading system, that trades a portfolio of strategies on different markets and time frames. The strategies are mined and robustness tested with a full automatic process using SQX[1] software. The portfolios run on live accounts of Global Prime FX brokerage[2]. This system is for personal use only and not for sale. Hence this article is solely intended for educational purposes. It was my personal challenge to keep it as short and simple (KISS) as possible for good readability.
 The name of this trading system “Clone Army” is derived from the famous army of Star Wars™. The idea behind is to develop a full automated process for mining and robustness testing of strategies (the original process) and then “clone” it. The clones are used to do strategy mining and robustness testing on all available markets[3] automatically.
The mining process
 To mine a strategy in SQX a variety of constraints have to be set in the builder[4]. Most important steps are to define a set of indicators, trading options, money management and to choose the market data for which we want to generate strategies. Strategy mining is a process, that fills its own books[5]. Most important point is, that a mined strategy with a good looking equity curve does not mean anything. We have to assume, that a mined strategy is curve fitted and therefore biased due to the data mining bias[6]. To overcome this, we need robustness[7] testing. It will be more clear, if you watch table 1. For every strategy, that is running live on Clone Army (current: 19) we need a total of about 17 billion mined strategies. That is a relationship of approximately 1: 900.000.000 (1 : 0.9bn)! To sort this kind of relationships in our minds, think of this: The chances of dying from a falling asteroid are around 1: 3.6 bn (see figure 1 ‐ second table). After reaching 4 live running and working strategies we are hit once from a falling asteroid or alternatively 200x times from lightning. So watch your head! Now you can imagine that we are dealing with extremely low probabilities to find a good working strategy. It’s like fishing for gold dust in the universe.

The robustness testing process
Because of the fact, that strategy mining is working with historical data, we logically only have an historical view of the performance of a mined strategy. As we know the words in nearly all disclaimers of financial institutions ”past performance is no guarantee of future returns”, we have to check that this performance is not biased due to the mining process. And chances are extremely high (nearly 100%) that we have exactly this problem. That is because of the nature of strategy mining, because we are puzzling millions over millions of combinations of indicators and indicators settings to achieve a good result. To check that a strategy is not just “curve fitted”, we need to perform robustness tests. There are a variety of technics[8] that can be used to evaluate, whether a strategy is just a best fit to a set of data or really has an edge to survive in real live trading market conditions.
 Robustness testing is like a funnel, where we fill in a myriad of strategies and only very few are dropping out. Table 1 is showing you the total of strategies and the corresponding percentages, that are filtered out due to robustness testing for “Clone Army”. There is a very good video course9 on SQX website, that shows you how to do it.

figure 1: robustness test filtering
At the end of this robustness tests, we end up with some candidates, that have the potential to be used on a live portfolio. As a rule of thumb, I needed about 3‐5 days of 24/7 calculation time with an EPYC[9] 750P2 32‐core with 2,5GHZ and 128GB RAM server to gather one single candidate. But as soon as you have this candidate: Be warned! In my experience we have to evaluate this candidates, whether they can actually proof their historical results under real live market conditions. Therefore we have to put these candidates on real live micro accounts and let them trade with the minimum available lot size (=micro). This process is what I call “micro account testing under supervision”.
Micro account testing process (“candidates under supervision”)
 As soon as you have some candidates, they have to show their potential under real market conditions. But why is that. Why not let them trade on a real market accounts with all our money straight away? The answer is: There is a risk, that the candidates will be showing bad performance on real market data. But why is that with respect to all our efforts until this point? One logical explanation is, that we have the risk that the tested historical data feed is different from the behavior of real live price data feed, that is provided from the broker. (This is especially true for non‐standardized CFD products, that can be very different). So technically, if the triggers for long and short positions of our code will be different because of the price feed then consequently the historical and future performance of the strategy will be different. We do not want to let this happen, because as a result it causes unpredicted behavior or easily said: streaks of losing trades or just losses. This will let diminish our hard earned money and has to be avoided. So to minimize this risk, we let these candidates trade on a real live micro accounts with price data feed of our favorite broker and evaluate the performance with respect to its historical performance. The goal is that a strategy has to show at least 30 trades with a P/F of 1.5 or greater. If this is proven, we can add our strategy to the portfolio on the master account. The bad news is, that this procedures takes time, a lot of time. To have an absolute minimum of a statistical evidence, we need at least a track record of 30 trades per strategy. Depending of the candidate strategy this could be a lengthy procedure of 6‐12 months of evaluation or even longer. To wait this long period of time can be pretty much frustrating. Especially if our candidate shows good performance right away from the start. But if this procedure is skipped we have a considerable risk, that our candidate performance is bad or at least unclear on the master account. Once again, this will put our hard earned money at risk. On the other hand, if we let an excellent strategy trade on micro for too long, we will miss good trading opportunities. So this is a dilemma . My personal solution is the following: “Learn the rules, so you know how to break them properly”13. If I see a strategy that has f.e. a P/F of 2.5 and is showing a good steady equity curve on live account, I will use it, even it has not shown all required 30 trades. On the other hand, if the results of a strategy with more than 30 trades are not convincing (“some good trades some bad trades” and “choppy equity curve”), then I wait. Until now this practical approach was doing pretty well.
From Micro to Master account (“Creating a portfolio”)
After some time of mining and testing we should have a couple of candidates, that have the potential to be used to trade within a portfolio on the master account. To transition from micro to master, I personally use the following procedure. First step is to sort the strategies on the micro account (candidates) in groups of markets (see figure 2).

Figure 2: Overview micro accounts (candidates)
Therefore I group them in the following markets EURUSD (1), GBPJPY (2), GBPUSD (3), USDJPY (4), AUDNZD (5), other FX pairs (6), XAUUSD15 (7) , DAX (8), Other Indices (9) as well as Energy & Commodities (10) and BTCUSD (11). So in other words all EURUSD strategies will be sorted into the EURUSD group all DAX strategies into the DAX group and so on. All groups have an individual micro live account with the corresponding name (like f.e. EURUSD). I personally call them support portfolios, because they are the “basic pot”, where we pick our best strategies from. In figure 2 the groups (“support portfolios”) of “Clone Army” are shown. This has the advantage to keep an overview about our overall project and to evaluate intermarket performance. This gives us very interesting insights because some markets are more handy to be used with fully automated strategies than others.
 After the candidates are sorted and grouped into our support portfolios, we want to know, which strategies to use on the master account. To achieve this we will run a correlation analysis. I personally use QuantAnalyzer[17] to do this. The goal is to have 1‐2 strategy per market with an intramarket correlation of less than 0.3. Then we repeat this procedure for every market, so we end up with a portfolio of 15‐20 strategies, that are pretty much uncorrelated. The best pick of strategies for the master account are shown in yellow in figure 2. And finally, now we have our master portfolio (all yellow strategies) of tested and uncorrelated strategies. Are we already done now?
Unfortunately not at all, the journey has just begun. As a next step we have to run our master portfolio and “treat it with love and caution like a raw egg”.
Excursus: Magic of uncorrelation
Before we come to the master account we have to speak about correlation. That is because this concept is very important. What will become clear with some experience is, that there is no perfect single strategy. There is no holy grail[18]. There are only trade‐off’s. Every type of strategy like trend, mean‐reversion or bias strategies will come with their pro’s and con’s. (f.e. trend strategies work well in strong trends and bad in sideway markets). In my opinion it is not possible to change their very natural behavior, even not with the best filters or additional indicators. Performance could be improved, yes, but the very core, the nature of a strategy, is likely not possible to change. So my postulation is: We just accept this fact and live with it. But the good news is: There is a solution for this problem.
The solution is correlation. Or in other words for our specific problem: It is uncorrelation. That is the magic, that brings everything together.
Technically speaking: It is the combination of different uncorrelated strategies within a portfolio with the goal to place a winning streak of one strategy into the drawdown of another strategy. With this knowledge we can accept the fact, that we cannot eliminate but reduce overall drawdown. And this is our goal, this is the magic that lies in the application of uncorrelation. In my personal opinion, this is the closest we can get to the holy grail. And the good news is, that this is something we can actively manage. We can find the best fit for our portfolio with the usage of correlation analysis.
So let’s have a look at the correlation of strategies of “Clone Army”. You can see in figure 3 that the strategies are highly uncorrelated (green). Only two strategies are showing some moderate correlation (red).

Figure 3: Correlation of strategies of Clone Army version 1‐4 based on profit/loss by day
Running the Master account
 It is a wise decision to run the master account as well as the support accounts on a dedicated trading server, that is separated from the mining server to make sure the system is up 99,99% of the time. We should avoid the nightmare of a crashed trading server with hundreds of unguided open positions at all costs! A periodically check of the open orders is also a good practice to verify that the open lots are in the predicted range. We definitely do not want to have a fat finger error causing a strategy to open 100 lots instead of 1 lot for example. This can wipe out all hard work in a few seconds.
So this thoughts bring us to the most important point running a master account: The money management (MM).
In my personal experience it is good practice to use 1% of our balance as stop loss for one single trade. For larger accounts 0,5% may be more appropriate. For smaller accounts up to 2% is realistic to stay within limits. But why do we want to use a percentage of balance and not trade with fixed lots?
The answer is: Compounded profits. What we want to achieve are strategies, that allow us to run them for years with solid profits. We definitely do not want to have a “mayfly”. This method will grow the balance of our account and consequently increase our positions, which will increase our balance and vice versa. This is a reciprocal cycle. If we use the current monthly profits of “Clone Army” which is 12,35% profit/month to make a prediction, we can see the power of compounded profits (blue line). For this graph I have chosen a hypothetical start balance of 10k EUR for demonstration.
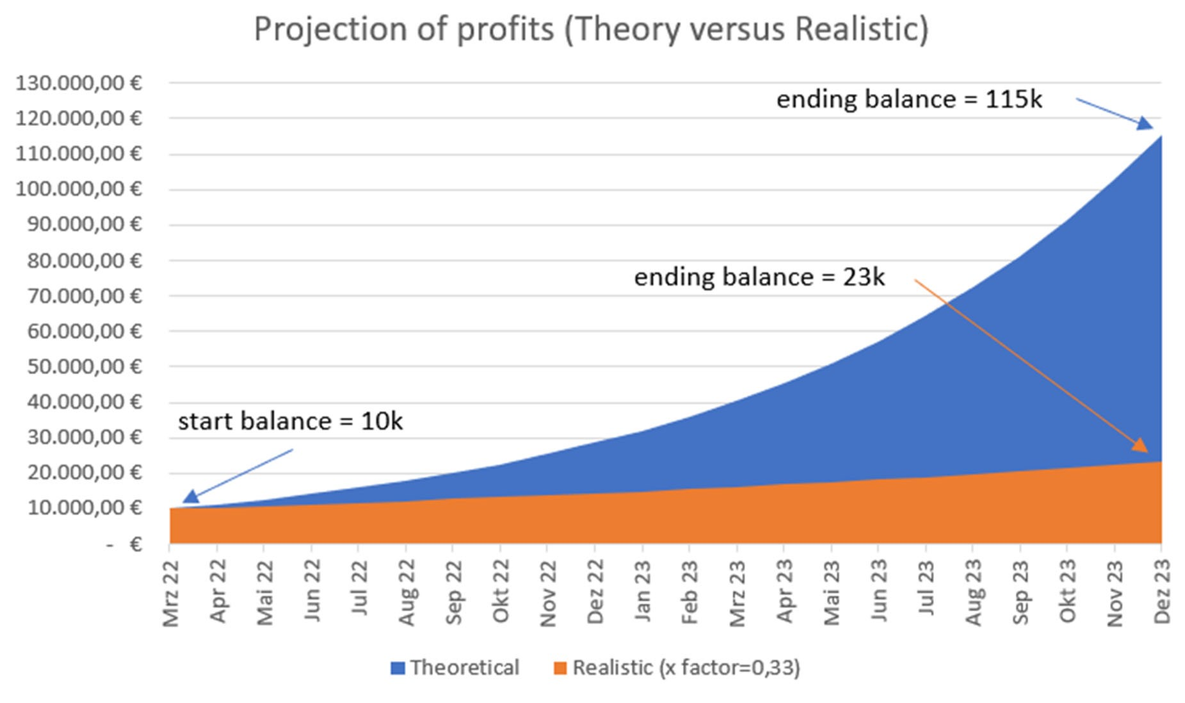
Figure 4: Predicted profits theoretical best case versus realistic approach with base = 10k EUR
Sure the blue line (extrapolation of 12,35% into the future) is an ideal prediction and unlikely to happen in real life. So we should apply a degeneration (reality) factor to see a more realistic outcome. My personal best guess is a reality factor of 33%[19], that will lead us to an average monthly profit of approx. 4%, which can be considered to be reachable (orange line). Hence, with an hypothetical starting balance of 10k EUR we can think of a realistic outcome of 23k EUR in 22 months, which is quite nice (+130%) in my personal perspective.
This insight leads us to the major advantage of this kind of trading system. That is the possibility of upscaling! As already discussed while our equity is growing, our position size does this accordingly. And it is technically feasible because FX, CFD and future trading is capable of opening up to 1000 lots in most brokers’ standard capability. If we come to the point, where 1000 lots is not enough to open 1% equity stop loss of our portfolio, this will be a long journey. We would need roughly a 50 million EUR account to have this kind of issue happen. So this will be no problem for 99,99% of the users. That means in other words, if we have managed to find a good portfolio, we could let it grow without almost any restrictions.
Last but not least I would like to mention, that our master account needs some nice care. Market regimes can change. The character of markets can change. Price data feed can change. With this in mind it is a good practice to periodically evaluate the performance of our best strategies on the master account. If performance deteriorates significantly, then it could be a sign to replace a bad performing strategy with a better one. And this should not cause any major problems, because we have a big pot of support strategies! I personally check my master on a quarterly basis, that means every 3 months.
Congratulations: If everything is done correctly, you have a good chance to be successful on the financial markets
Performance
Let’s have a look at the most important point: The performance of “Clone Army” under real life conditions with real money. This analysis was started in September 2021 with beginning of version 2 of “Clone Army”, because this was the point where I had enough candidates to build a solid foundation for the master account. Therefore data from pre‐version 1 (α‐version) was skipped in this analysis.
Here you can see the performance overview in myfxbook.com.
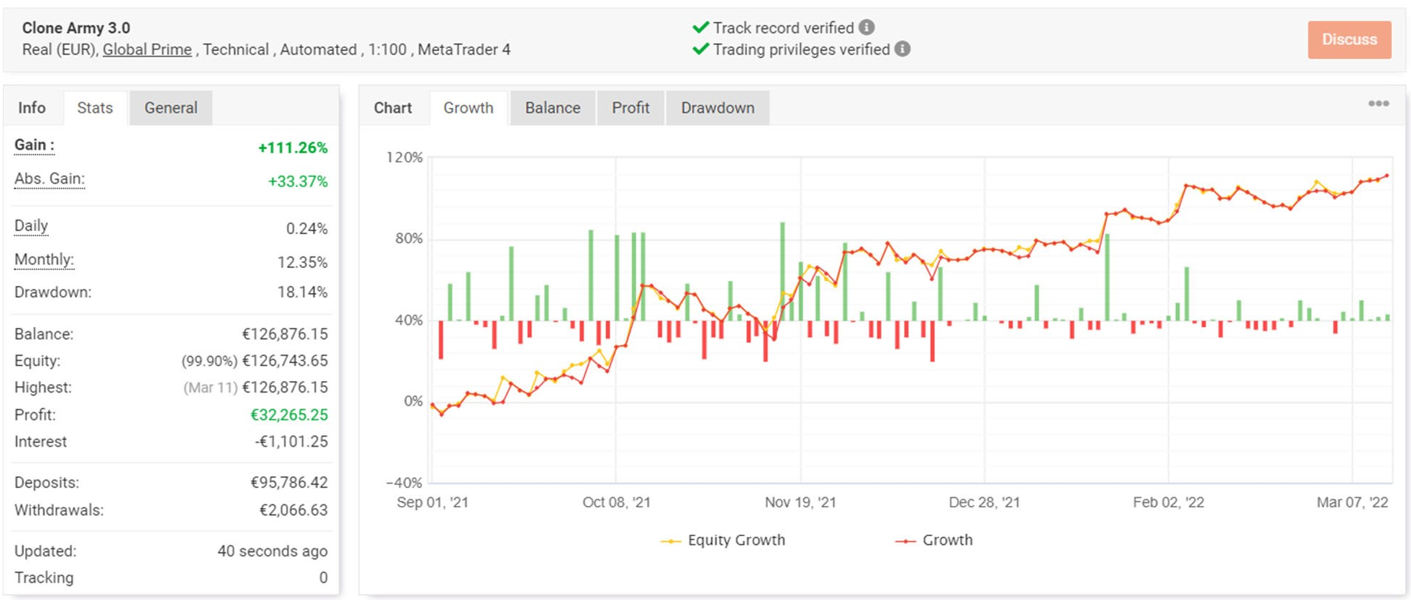
Figure 5: Equity curve and overall stats
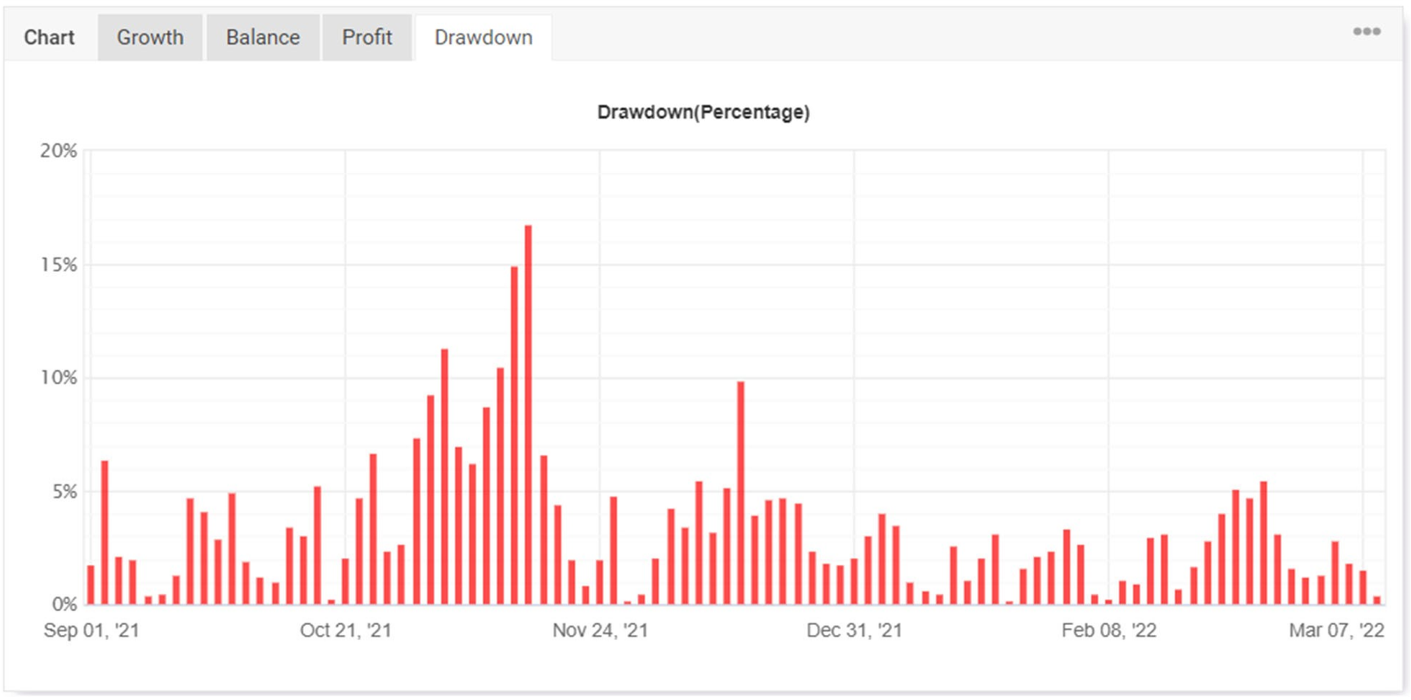
Figure 6: Drawdown by day
We achieve an average monthly profit of 12,35% with a maximum drawdown of 18,14% and an average drawdown of 3,49%, that I calculated manually out of the trading data. This leads us to an annual calmar22 ratio of 8,223.
What is important to notice is a smooth upsloping equity curve. This is exactly what we are aiming for. We can see also periods of drawdown. But this is ok and we have to accept this. The most important point to mention here is to have enough confidence in our portfolio to stick with it even in extending periods of drawdown. If you give it up to early, all hard work is “blown into the wind”.
- The Calmar ratio is determined by taking the investment fund’s estimated annual rate of return, usually for a three‐year term, and dividing it by its maximum drawdown.(Wikipedia)
- 12,35% profit/month x 12 months / 18,35% max DD
As additional information you can see “Clone Army’s” asset popularity.
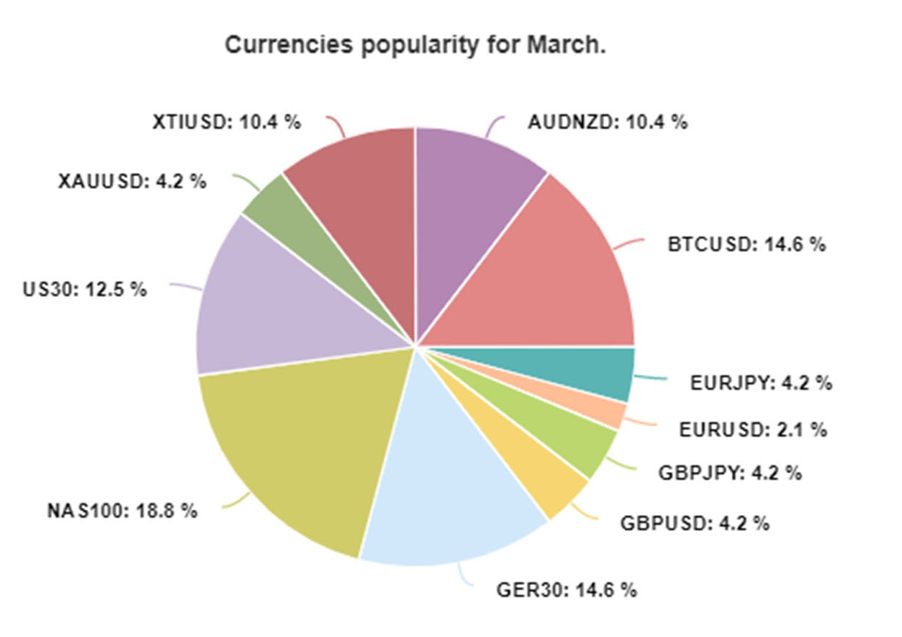
Figure 7: Chart of asset popularity March 2022
In terms of quality score number we reach an nice 3,6.

Figure 8: Calculation und Grouping System Quality Number
If we look at the duration of trades, we see that the maximum duration is 5 days. That is logical because we only use Friday close only as trading option. So consequently we do not have to worry about weekend risk.
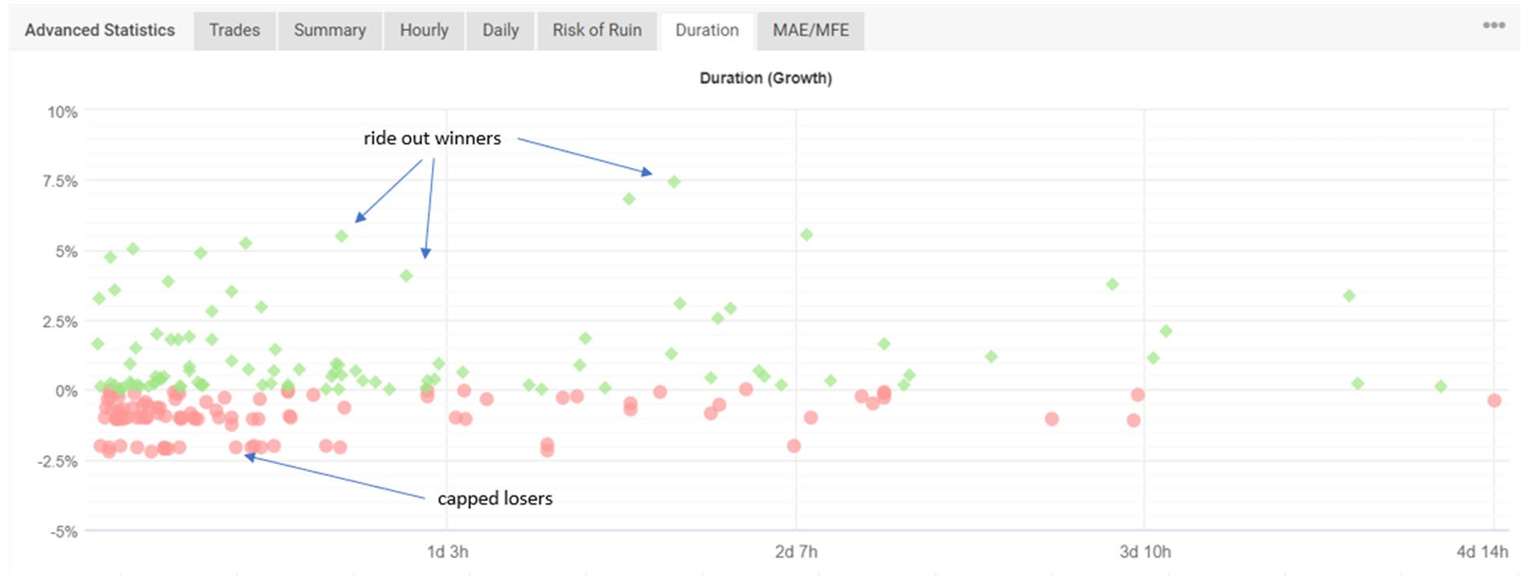
Figure 9: Duration of trades
A very important insight is this graph is that the losers are cut off at stop loss of 1% or 2% (beginning of version 2, then changed back to 1%) respectively and winners are ride out. This asymmetrical behavior is the very root cause, why this portfolio works. It is a funny thing the algo’s come to the same conclusion of the old wisdom “cut losers and ride out winners”. Is this just coincidence?
Benchmark results
It is hard to find something to benchmark with. So I was evaluating the portfolios of myfx autotrade.com[20] to have any kind of comparison. I made a graph, where maximum drawdown is depicted on the y‐axis and monthly profits on the x‐axis. You can see that “Clone Army” is doing pretty well. Notably the max drawdown with respect to the achieved profit is quite low in comparison to the other portfolios. One possible explanation is that on myfxautotrade.com only forex portfolios are used. Due to the nature of “Clone Army” that is also using Indices, Commodities and Crypto, the variety and therefore uncorrelation is greater, which brings us to the postulation that more uncorrelated strategies consequently lead to less drawdown (and higher profits) compared to the average of forex only portfolios. This graph could be a first indication, that this postulation could be true.
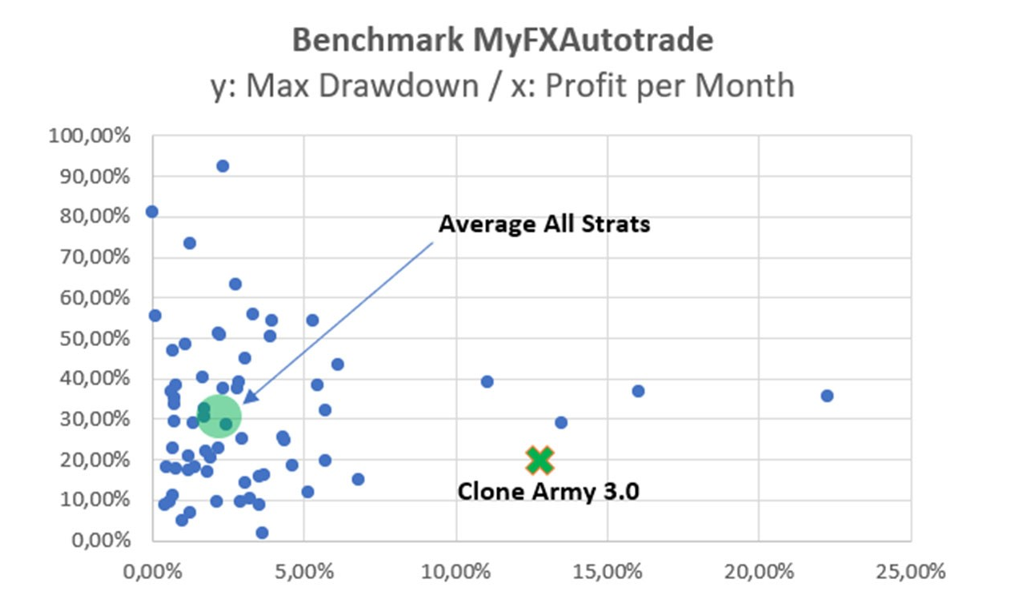
Figure 10: Benchmark “Clone Army” compared to strategies on myfxautotrade.com
Critical considerations
There is a lot of skepticism when it comes to full automated strategies. So one counter argument could be, that the shown profits of “Clone Army” are due to luck and have no sustainability in the future.
Although it is true, that we only can evaluate the performance until now and profits of “Clone Army” could theoretically turn dramatically worse one day after this article was written, I do personally not think it is likely to happen. Regrettably we only can evaluate what we see as performance facts here and now.
If we want to see what’s happening in the future, we have to make a reevaluation after some time. Unfortunately I do not own a crystal ball to predict the future, so that’s the only way to do it. Hence that could be a good point for an update of this article.
Regarding the second argument, that the results are only due to luck: This is highly unlikely. To achieve a profit factor of 1.4 with 271 trades only due to luck has a probability of 0,17% if we calculate it with a binomial‐distribution[21] with a possibility of 50% to have a winner or losing trade. In reality this is much worse[22], so in my personal opinion it is almost impossible to reach this performance only due to luck[23] especially if we take into account that 65%‐80% of retail clients[24] lose money in trading with derivate products.
And finally, according to the scientific method[25] a thesis is as long valid as long as their contrary is not proven, so we can assume that we have found a good way to make risk adjusted profits so far.
Summary
 Until now the “Clone Army” is exactly doing what it is supposed to do. It gives us considerably profits that comes in conjunction with a low drawdown due to solid money management and therefore low risk. We cannot eliminate all risks, but we can do everything to minimize it. That gives me personally a good sleep with the knowledge my army is doing a good and safe job. In this sense “may the force be with you and happy trading”.
ChrisWhite
If you have questions, comments, suggestions or criticism, you can reach me on the SQX or Global Prime Discord server under ChrisWhite ID: 5390.
You can request a personal link to watch and follow the performance of “Clone Army”. Just give me a direct message on discord.
[1] https://strategyquant.com
[2] https://www.globalprime.com
[3] Available markets are: Forex, CFD, futures, energies, commodities and crypto
[4] Builder is a strategy mining tool within SQX software
[5] Please refer to Strategy Quant User Guide, ebook “How to trade profitable in forex using Strategy Quant
Software” and documentation & tutorials on SQX website
[6] Evidence Based Technical Analysis, David Aronson, 2007, page 107ff
[7] Please refer to chapter cross checks – robustness tests on SQX website
[8] Out‐of‐sampling (OOS) testing, other market testing, testing different time frames, Monte‐Carlo (MC) analysis, walk‐forward analysis, what‐if analysis, SPP (system parameter permutation), graphical analysis on local parameter highs, manual curve evaluations, optimization analysis and micro account testing 9 Please refer to the video tutorials on SQX website
[9] Personal first choice are Hetzner servers https://www.hetzner.com
[10] P/F = profit factor
[11] Error type I: Bad strategy on Live versus Error type 2: Missed opportunity
[12] Instructions for Life – Dalai Lama
[13] P/F = profit factor
[14] Major and Minor FX pairs with very low number of candidates 16 Gold
[15] Dow Jones (US30), Nasdaq100 (NQ100)
[16] WTI (crude), NGAS (natural gas), soft commodities (soybean, wheat, corn,…)
[17] Quant Analyser 4.0: Tool from Strategy Quant to analyse and manage portfolios
[18] If you do not believe it, then think about the end of the movie “Monthy Python and the Holy Grail”
[19] Reduction of minus 66%
[20] https://myfxautotrade.com
[21] https://en.wikipedia.org/wiki/Binomial_distribution with N=271, k=160, p=0,5
[22] Due to transaction costs
[23] Simplified, we can reject the null hypothesis H(0): “Clone Army has no edge in trading on real markets and profits are due to luck” with p=0.0017 as very statistically significant (p<0,01)
[24] See disclaimers on various online brokers ranging from 65%‐80%
[25] Evidence based Technical Analysis, The Scientific Method and Technical Analysis Chapter 3, page 94
 Tomas Vanek

This is excellent and very helpful !!! I will need time to analyze it . Thank you very much for this work
You are welcome! I do my very best!
This is very interesting, I am wondering how many more strategies could we find with a selection of “random group” building blocks, eliminating some confusing Building blocks. The search should be more efficient, with even higher quality strategies. This will be very interesting.
I only used predefined signals for strategy mining and no random groups. So unfortunately no experience with the usage of random blocks.
Excellent, but I have some questions about the details.
1.Do MonteCarlo Tests & Mannual Evaluation mean randomizing system parameters retest with probability x% and max change y%?
2.If portfolio is 20 strategies, using money management with 1% risk level ,is every strategy applied with balance*1%/max loss of every strategy or all strategies consistently applied with balance *1%/max loss of Portfolio?
Do MonteCarlo Tests & Mannual Evaluation mean randomizing system parameters retest with probability x% and max change y%? In my tests MonteCarlo Tests means: 1.) Randomize Trades Order with Resampling 2.) Randomize Historical Data 3.) Randomize Slippage 4.) Randomize Spread 5.) Optimization Profile / System Parameter Permutation Manual Evaluation means: Visually checking the equity curve. Goal: Upsloping & smooth. Visually check Monte Carlo Resampling curves. Narrow fan. Most of curves above original. If portfolio is 20 strategies, using money management with 1% risk level ,is every strategy applied with balance*1%/max loss of every strategy or all strategies consistently applied with balance *1%/max loss of Portfolio? It’s… Read more »
Hi Kornel,
Thanks for the detailed writeup.
On your robustness testing did you use the default settings that come with SQX. If not, how do I determine the proper parameter values to use?
On money management, did you develop the strategies you were going to trade live or did you choose the best money management after your initial strategy selection?
Thanks
B.
On your robustness testing did you use the default settings that come with SQX. If not, how do I determine the proper parameter values to use? I used the parameter value from the video course as base and was developing them further for my needs. On money management, did you develop the strategies you were going to trade live or did you choose the best money management after your initial strategy selection? During backtesting and robustness tests MM was set to fixed lot to have the strats comparable for evaluation. After I’ve picked the best candidates I switched from fixed… Read more »
Chris is it possible to share your WFm setting and metrics
Please write me a direct message (DM) on discord (ChrisWhite:5390). I will see, what I can do for you!
hello, please help me , i need a support, i have some strategies working the 6 monts ago it was very impressive, but in this month it is very differente, could you help me to “identify or any tip” for erasing strategyes, for example, the DD > 1.5x historical or the PF is < than x number, please could you help me with this tip? thank you
Please write me a direct message (DM) on discord (ChrisWhite:5390). Maybe I can give you a little hint.
Good evening, i kindly ask you a little deep detail regarding the mining phase for Commodities markets, BTCUSD: this markets have few history data if i compare with for example with Forex. How to manage this ?
1) do you mining the strategies in few year available and the rest of data you dedicate for the robustness tests ?
2) Do you mining the strategies and all robustness test in the specific market where you have a lot of history data and after that you back test this strategy in the markets like commodities or BTCUSD?
to 1.) This is tricky indeed. But I work with the data I have. So basically yes. Mining for data available and run robustness test with rest of data. If strat has no edge it will be filtered out in micro account.
to 2.) No, i don’t do that. The mined & tested asset is the traded asset.
Hello, thanks por the post, I have some questions.
1.Why is not public fxbook acc?
2.What is the video that you mention in:
3.How many building blocks u use?
Thanks!
to 1.) I provide myfxbook account on request on Discord: ChrisWhite: 5390. No benefit for me to make it public at the moment.
to 2.) -> Dashboard -> AlgoTradingVideoCourse -> Lesson 06 strategy robustness testing
to 3.) depends, sometimes all blocks, sometimes a selection of the usual suspects (BB, MA, KC, RSI,…)
Looks like the trading course might be gone…
If you mean the StrategyLab, do not worry, it will re-open again very soon!
Thanks a lot Chris for your extended and helpful analysis of your project but I have some question.
How could you create for every strategy a total of about 17 billion mined strategies? Even with an EPYC7502P processor and only use of predefined signals it seems quite difficult for someone to create 17 billion strategies in 3 to 5 days. I have an equal processor with yours and I can’t create so much strategies. Not even close to your number.
Would you like to define which one or more of SQ predefined configuration you used in mining process?
Thank you
Actually 17bn strats were mined in several months not some days. It takes a quite long time… For your further question please write me on Discord: ChrisWhite:5390
Hi Chris, Thank you so much for sharing. I have been struggling for months with my workflow but I have learned many valuable insights from your post. If you don’t mind, can I ask you a few questions? 1) Are the robustness tests in table done in the sequence of top-to-bottom? 2) What are your thoughts of doing “Last OOS Test” straight after doing “First OOS Test”? This can significantly cut down on computing time that are wasted on strategies that were going to fail the “Last OOS Test”. On the flipside, I think this will also introduce more datamining-bias… Read more »
Where did the portfolio go?
This is a really fantastic explanation ! Really clear and inspiring with a lot of interesting hints.
I have just one question:
If I well understand table 1, the whole set of tests, excluding the last step, filters out 2/1000 strategies while the last one (MC and manual evaluation) filters out 5/1Million strategies..
Is this correct ? From my (short) experience with StrategyQuant the whole set of MC is not so stringent, unless you use a much tougher set of conditions compared to those that are described in the training course. Is this the case ?
Thank you
I have another question:
Why using such a long period of real trading using micro-accounts ?
Wouldn’t it be possible to shorten this period after doing a trade-by-trade comparision of backtesting on both StrategyQuant and MT4/5 using tick-data accuracy (e.g. on one year data) ? Of course the backtesting performed through MT4/5 should use the data provided by the broker used for real trading, not those used to produce the strategies.
Hello ChrisWhite, Thank you for your sharing a good information here. I have a question for the Builder Strategies Part, It’s 169 Billion of Strategies you had generated, May I know did you generated without any ranking criteria? Hope you can guide me this. Thank you.
What is the pair u used to crosscheck on additional market for AUDNZD?